

Executive Summary
MAPCs rose 15% YoY to a record 180 million, the fastest growth since early 2024, driven by 10 million new customers. Trip volumes increased 18% for the third straight quarter to 3.3 billion, averaging 36 million trips per day, while higher engagement lifted trips per customer to a record 6.1 per month. Uber One membership surged 60% to 36 million (now 20% of the customer base), supported by geographic expansion and new benefits. Gross Bookings accelerated 17% to $46.8 billion.
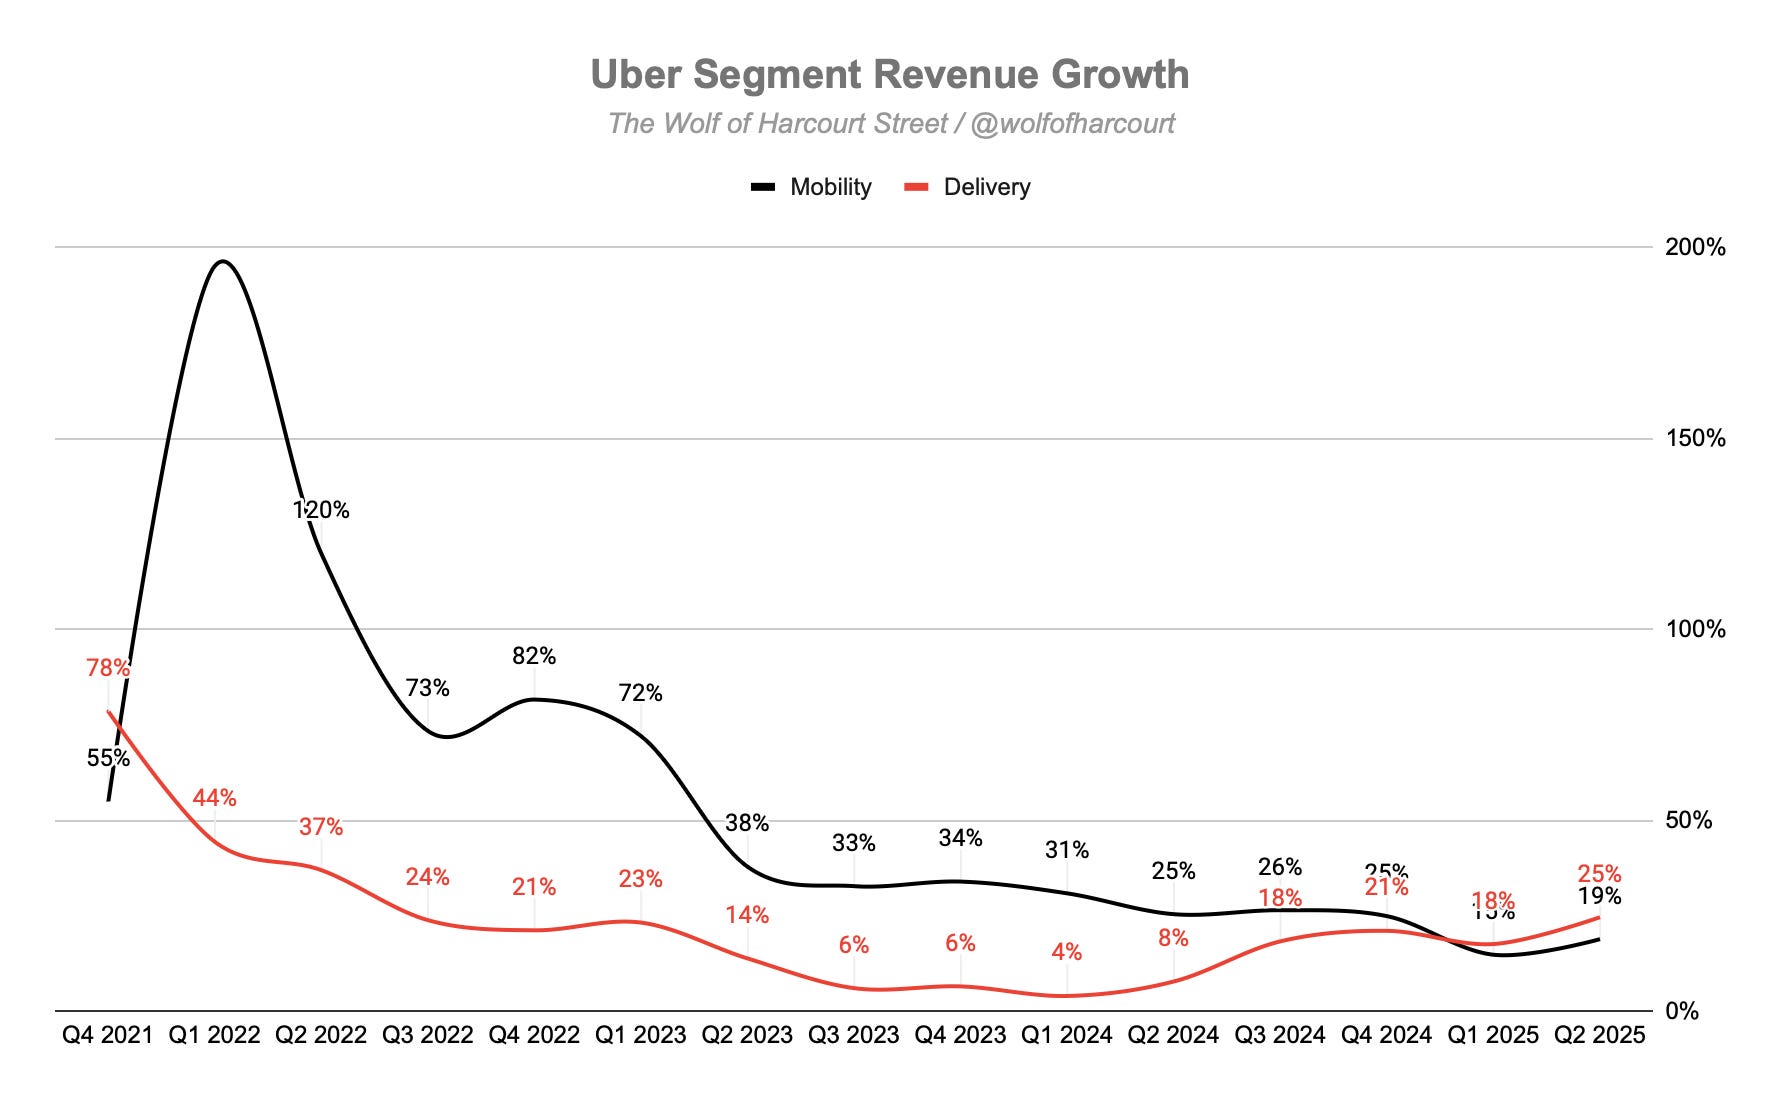
Revenue grew 18% YoY to $12.7 billion, accelerating from 14% in Q1 2025, with constant currency growth matching this pace. Mobility revenue reached $7.3 billion, up 19% (18% constant currency), driven by record engagement and slower price growth as insurance costs eased. Delivery revenue grew 25% (23% constant currency) to $4.1 billion, its fastest pace since Q2 2022, fueled by higher membership adoption and robust G&R services growth.
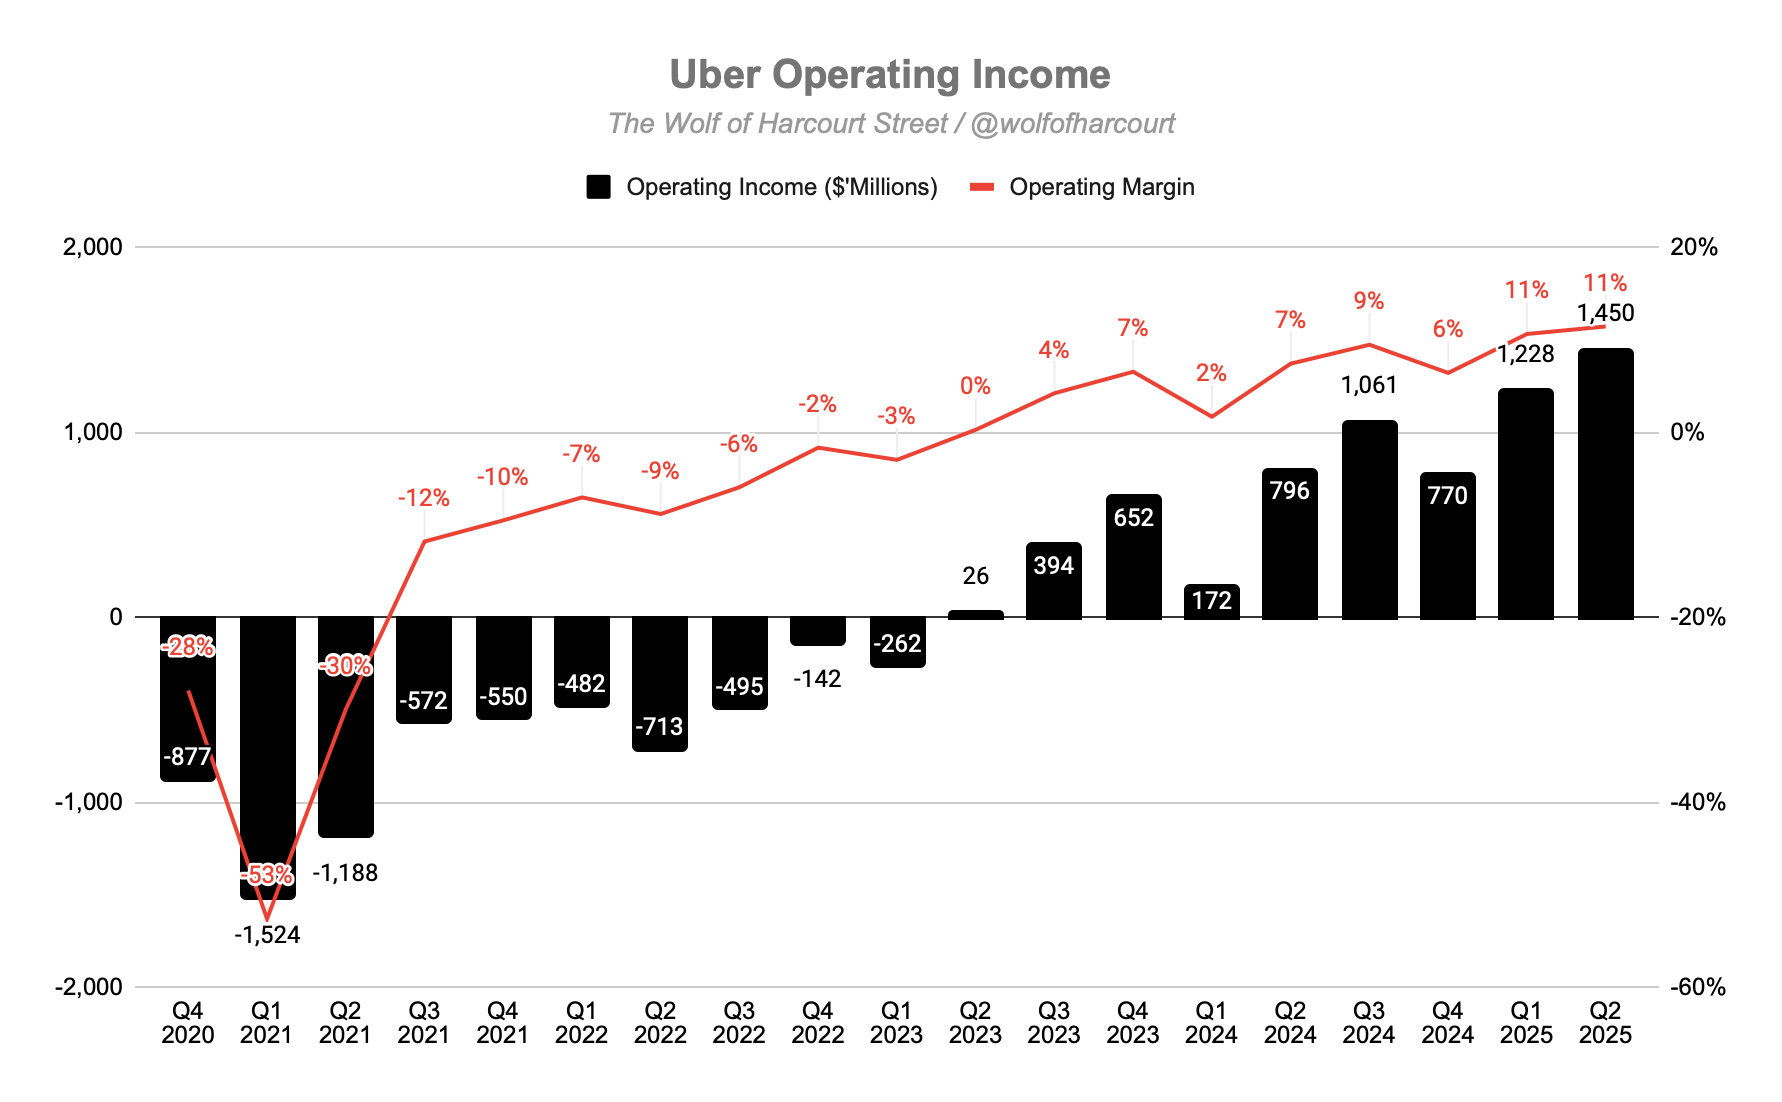
Operating margin rose to 11% from 7% a year ago, with operating income hitting a record $1.5 billion. Sales and Marketing, the company’s largest operating expense, has dropped from nearly 40% of revenue at its peak to just 9–10% for the past two years, reflecting greater efficiency in customer acquisition. An additional $95 million in S&M spend generated $2 billion in incremental revenue (a 20x return), aided by cross-platform engagement, where customers using both Mobility and Delivery show 35% higher retention and triple the gross bookings and profits of single-service users.
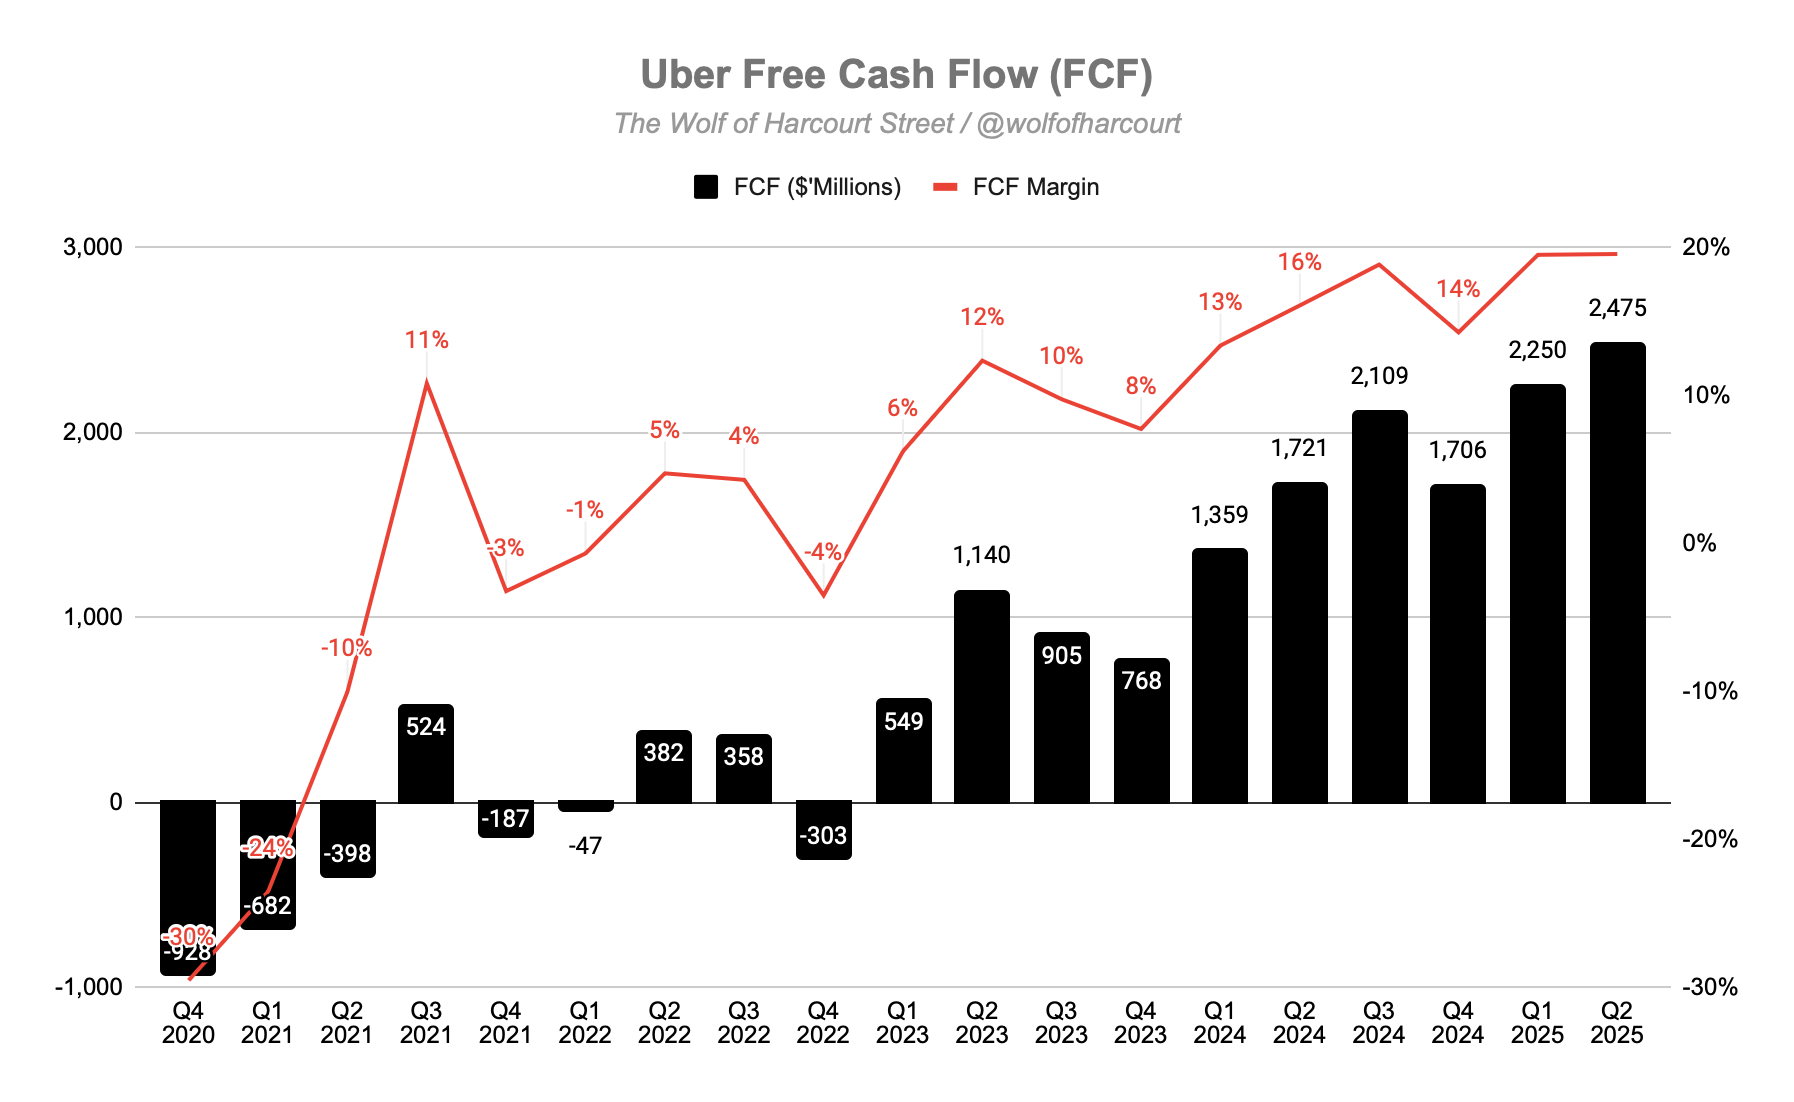
Cash generation was strong, with operating cash flow up 41% to $2.6 billion and free cash flow up 44% to $2.5 billion, driving a record $8.5 billion in trailing twelve-month FCF. Uber’s asset-light model, low CapEx, and disciplined capital allocation, including a new $20 billion buyback program and a goal to reduce share count, have transformed its FCF margin from -10% to +20% in just four years.
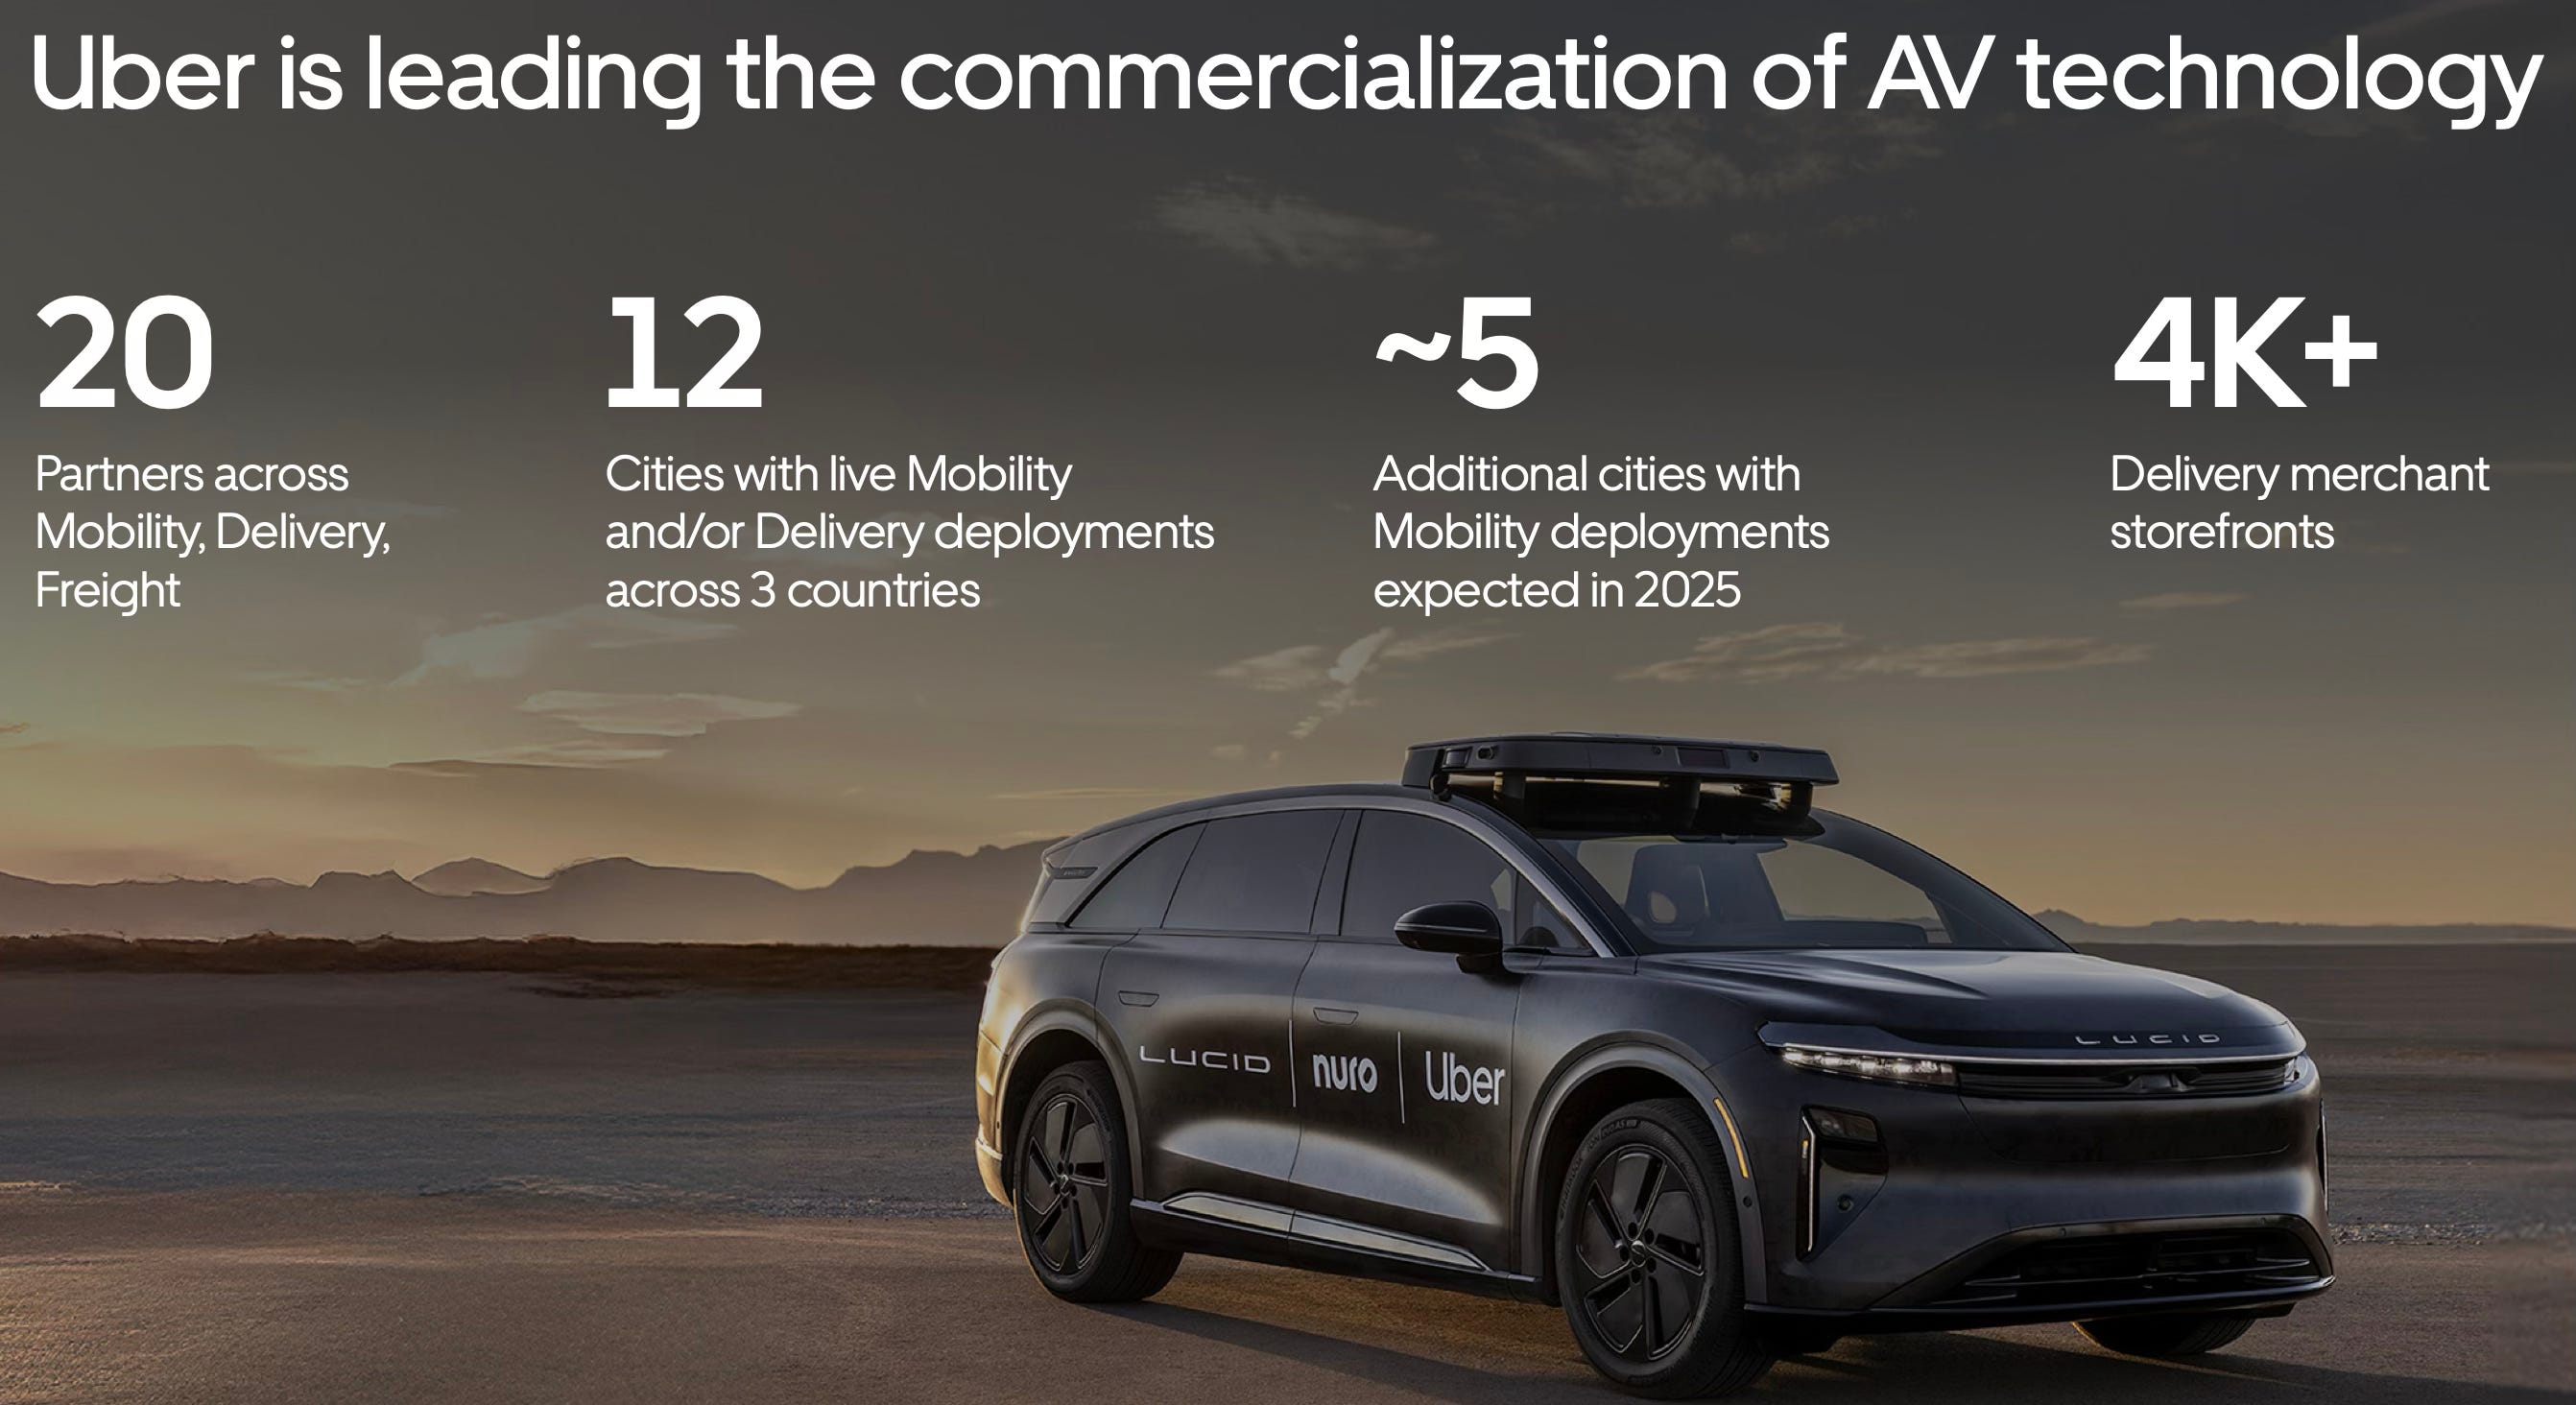
While autonomous vehicles remain seen as the company’s largest existential risk, Uber is actively leading commercialisation through partnerships with 20 AV companies and expanding high-performing deployments such as Waymo. Its unmatched ride-hail dataset positions it as a key player in real-world AI, with plans for multiple AV business models, from merchant and agency structures to outright ownership.

Contents
Financial Highlights
Wall Street Expectations
Business Activity
Financial Analysis
Guidance
Conclusion
1. Financial Highlights
Revenue: $12.65 billion (+18% YoY)
Mobility: $7.29 billion (+19% YoY)
Delivery: $4.10 billion (+25% YoY)
Freight: $1.26 billion (-1% YoY)
Operating Income: $1.45 billion (+82% YoY)
Net Income: $1.36 billion (+33% YoY)
Adjusted EBITDA: $2.11 billion (+35% YoY)
2. Wall Street Expectations
Revenue: $12.47 billion (beat by 1%)
EPS: $0.62 (beat by 2%)
3. Business Activity
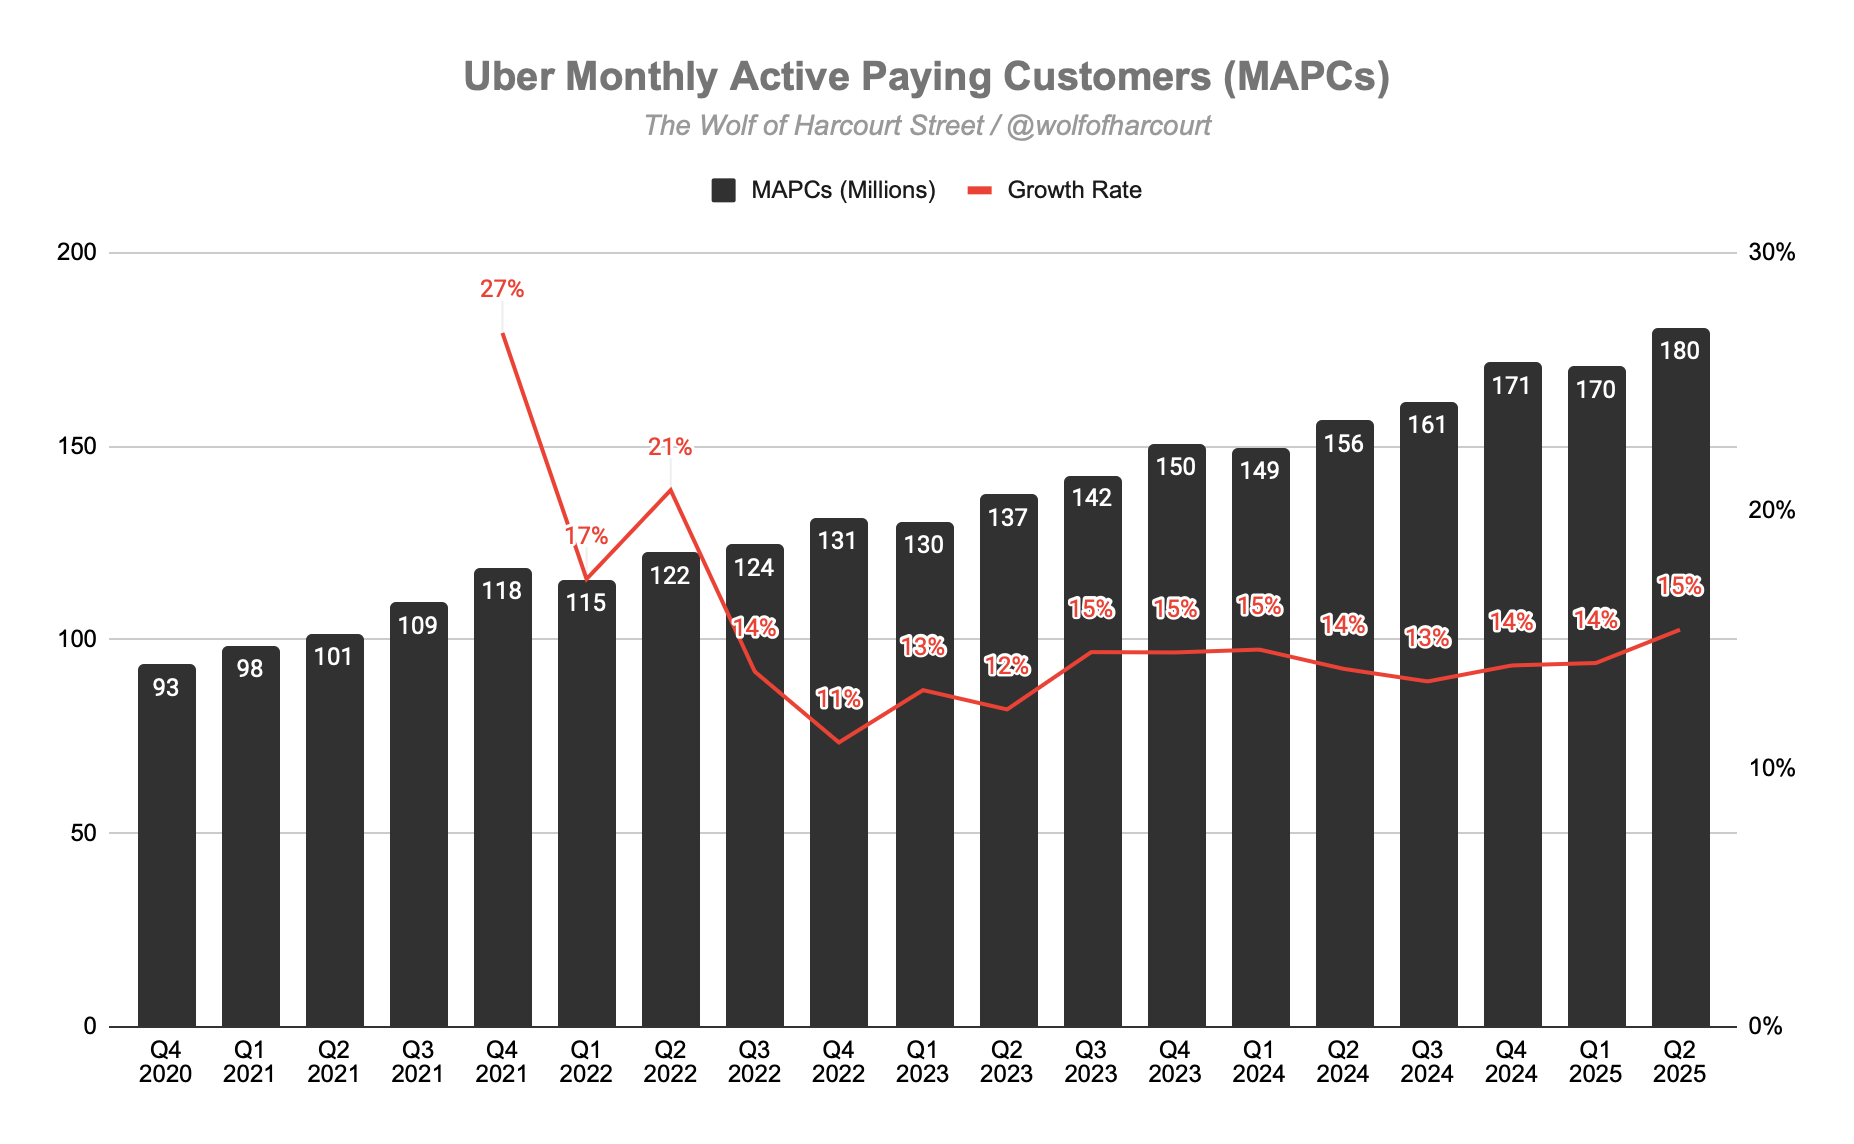
Monthly Active Paying Customers (MAPCs)
MAPCs grew 15% YoY to a record 180 million, the fastest growth rate since Q1 2024. Ten million new MAPCs joined during the quarter, driving growth acceleration.
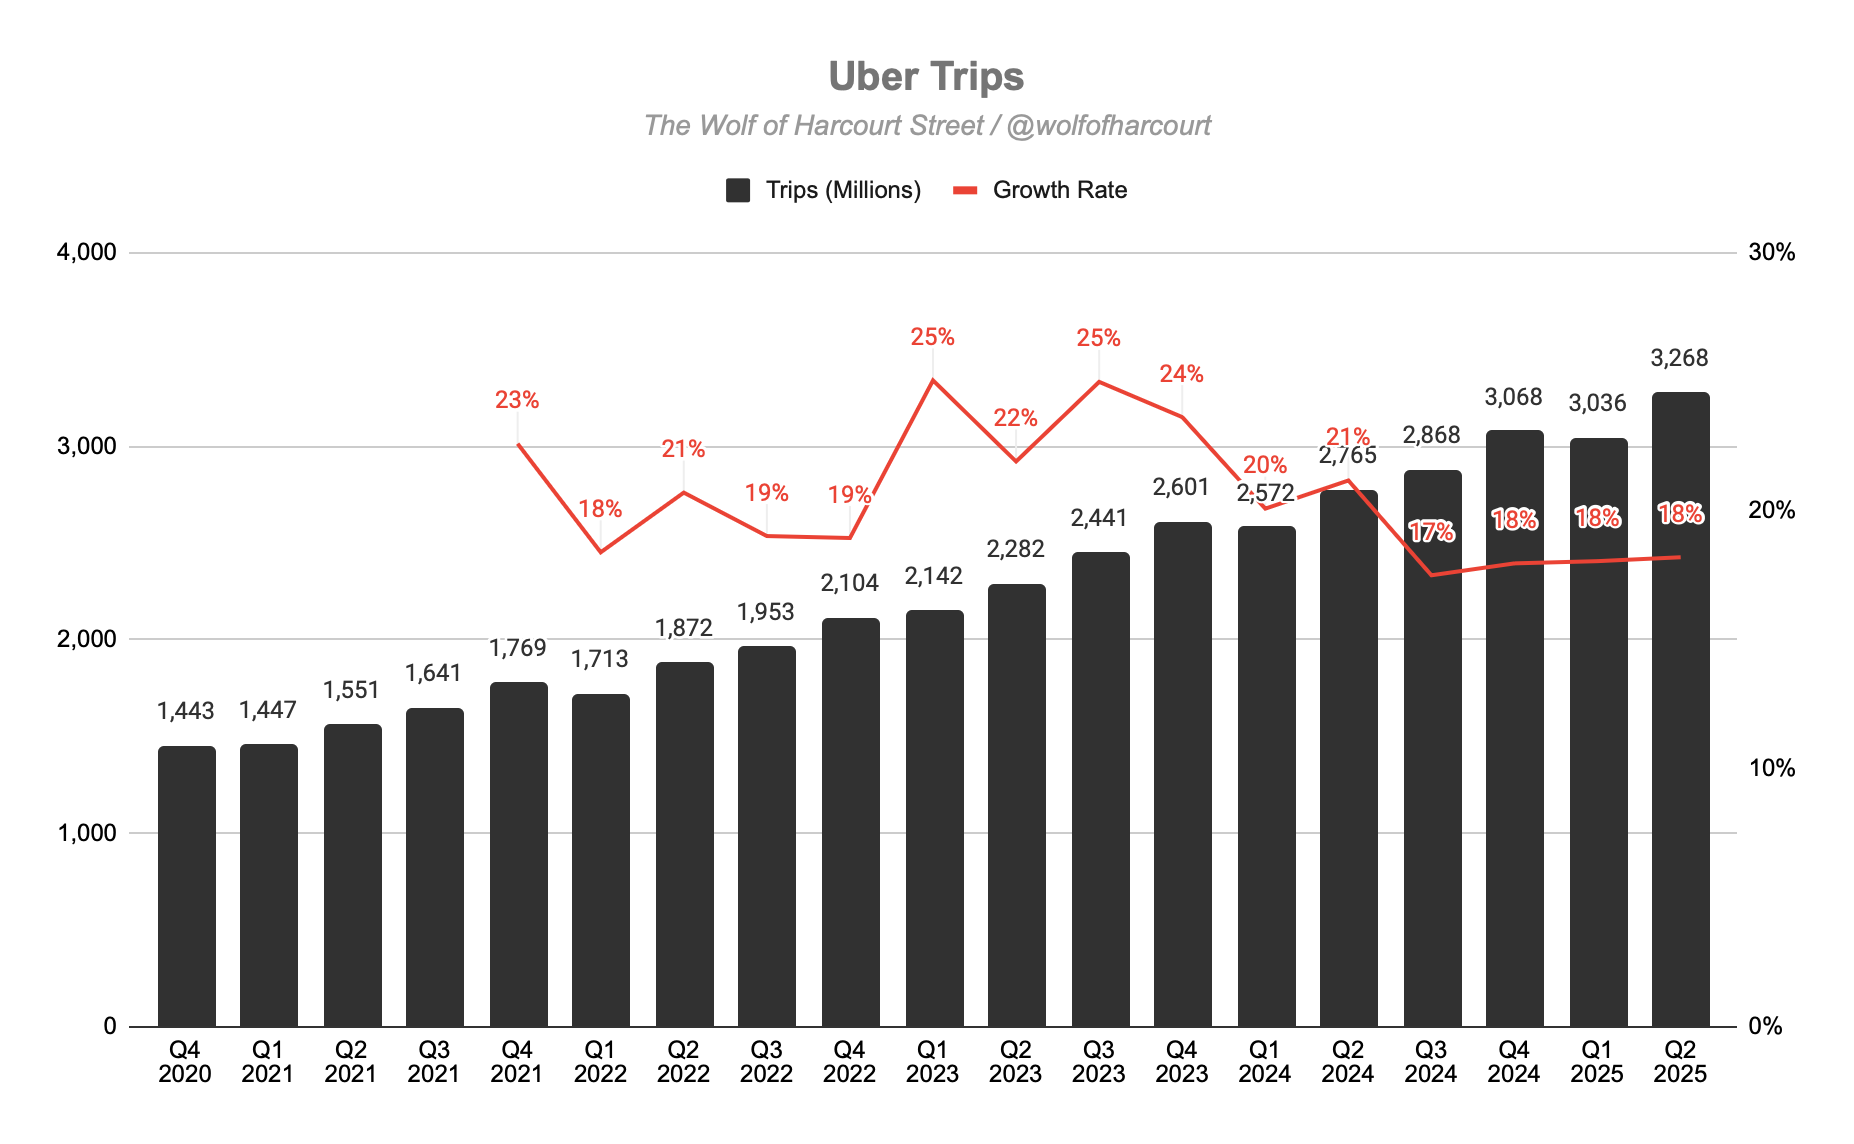
Trips
Trip volume rose 18% YoY for the third consecutive quarter, reaching 3.3 billion. Uber averaged 36 million trips per day.
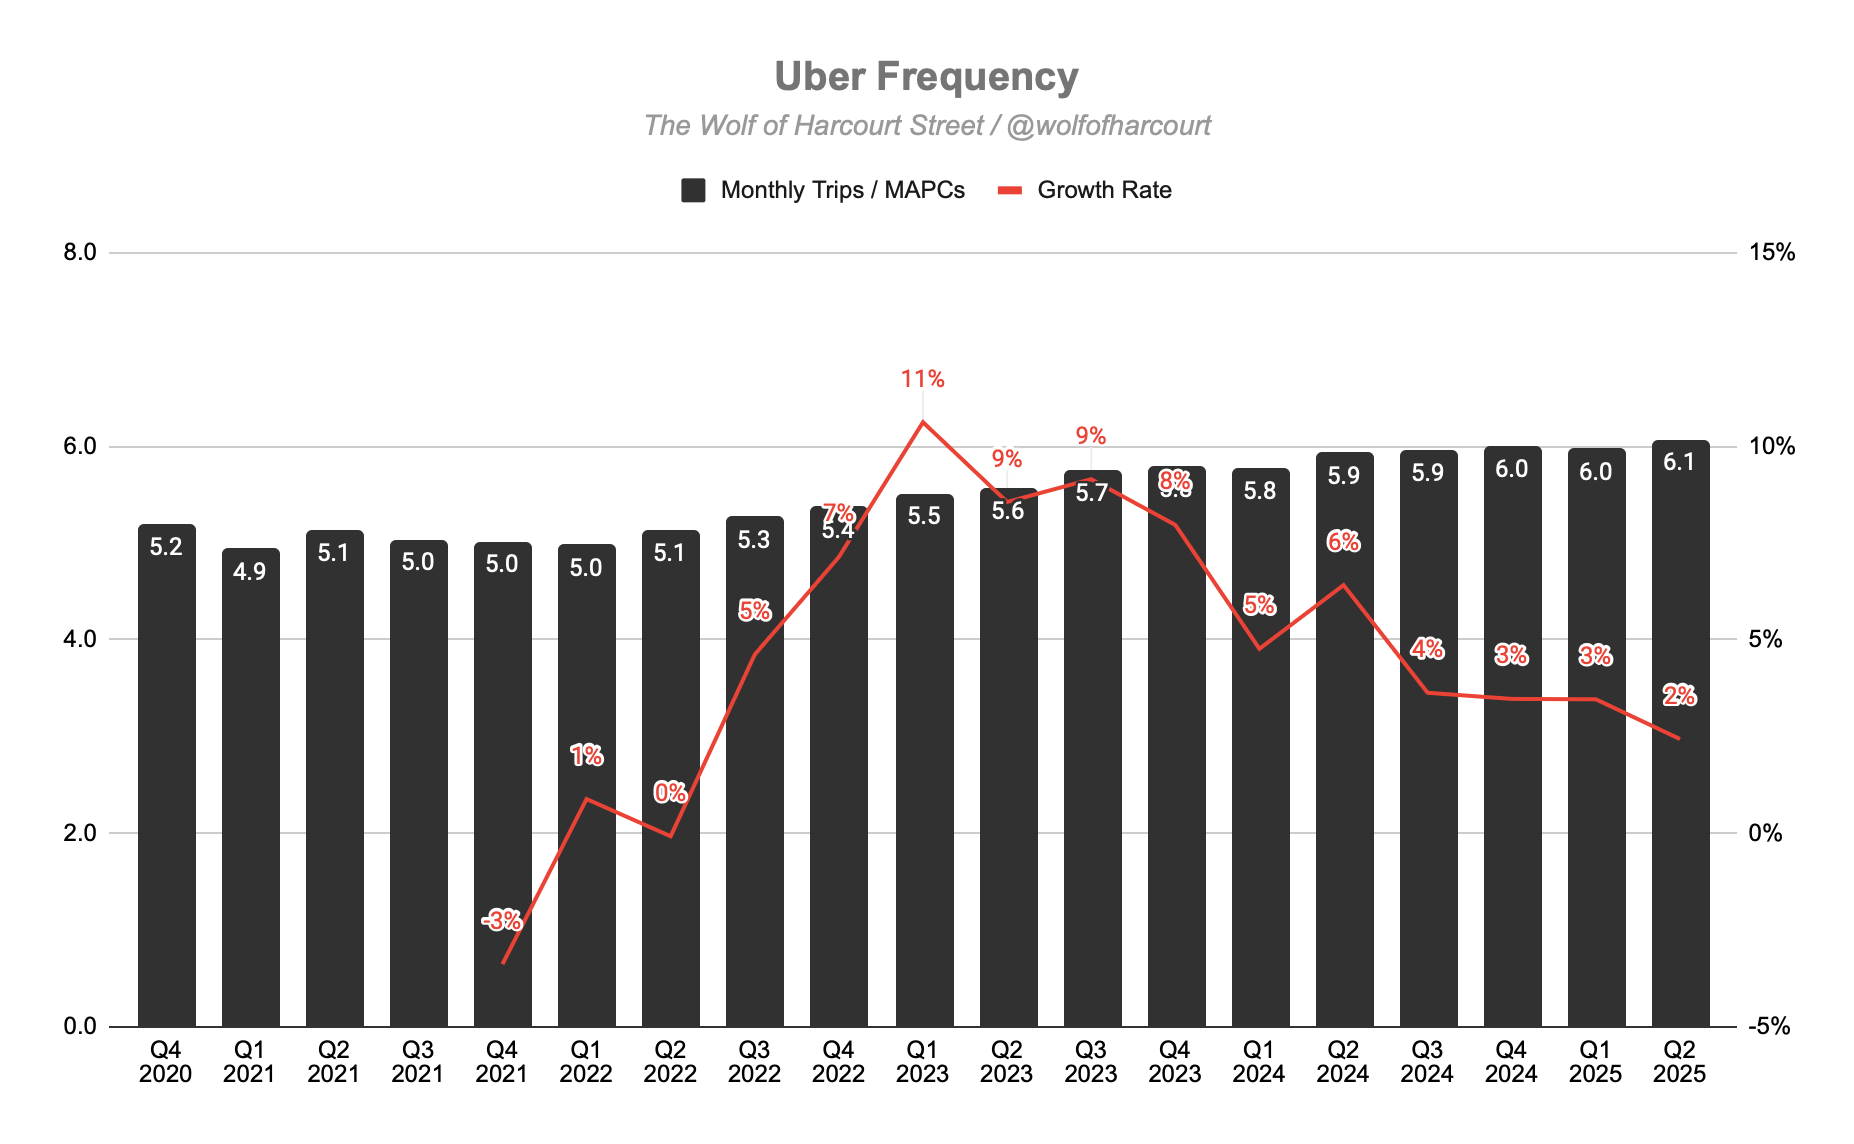
Frequency
Trips grew faster than MAPCs, leading to a 2% YoY increase in trips per MAPC to 6.1 per month, a new high.
Membership
The Uber One program grew 60% YoY to 36 million members, now 20% of MAPCs (up from 18% at the end of 2024). Growth potential remains large, supported by geographic expansion and new benefits. In Q2, Uber One launched in Argentina and extended Mobility benefits to seven more countries.
Post-quarter, Uber introduced surge savings in the US to improve affordability during peak demand, added micromobility perks (10% credit back on Lime trips and free unlocks), and continued building high-value benefits for members.
Uber’s platform strategy focuses on acquiring new users, converting them into cross-platform customers, and deepening engagement. Cross-platform users produce more than 40% of combined Delivery and Mobility Gross Bookings.
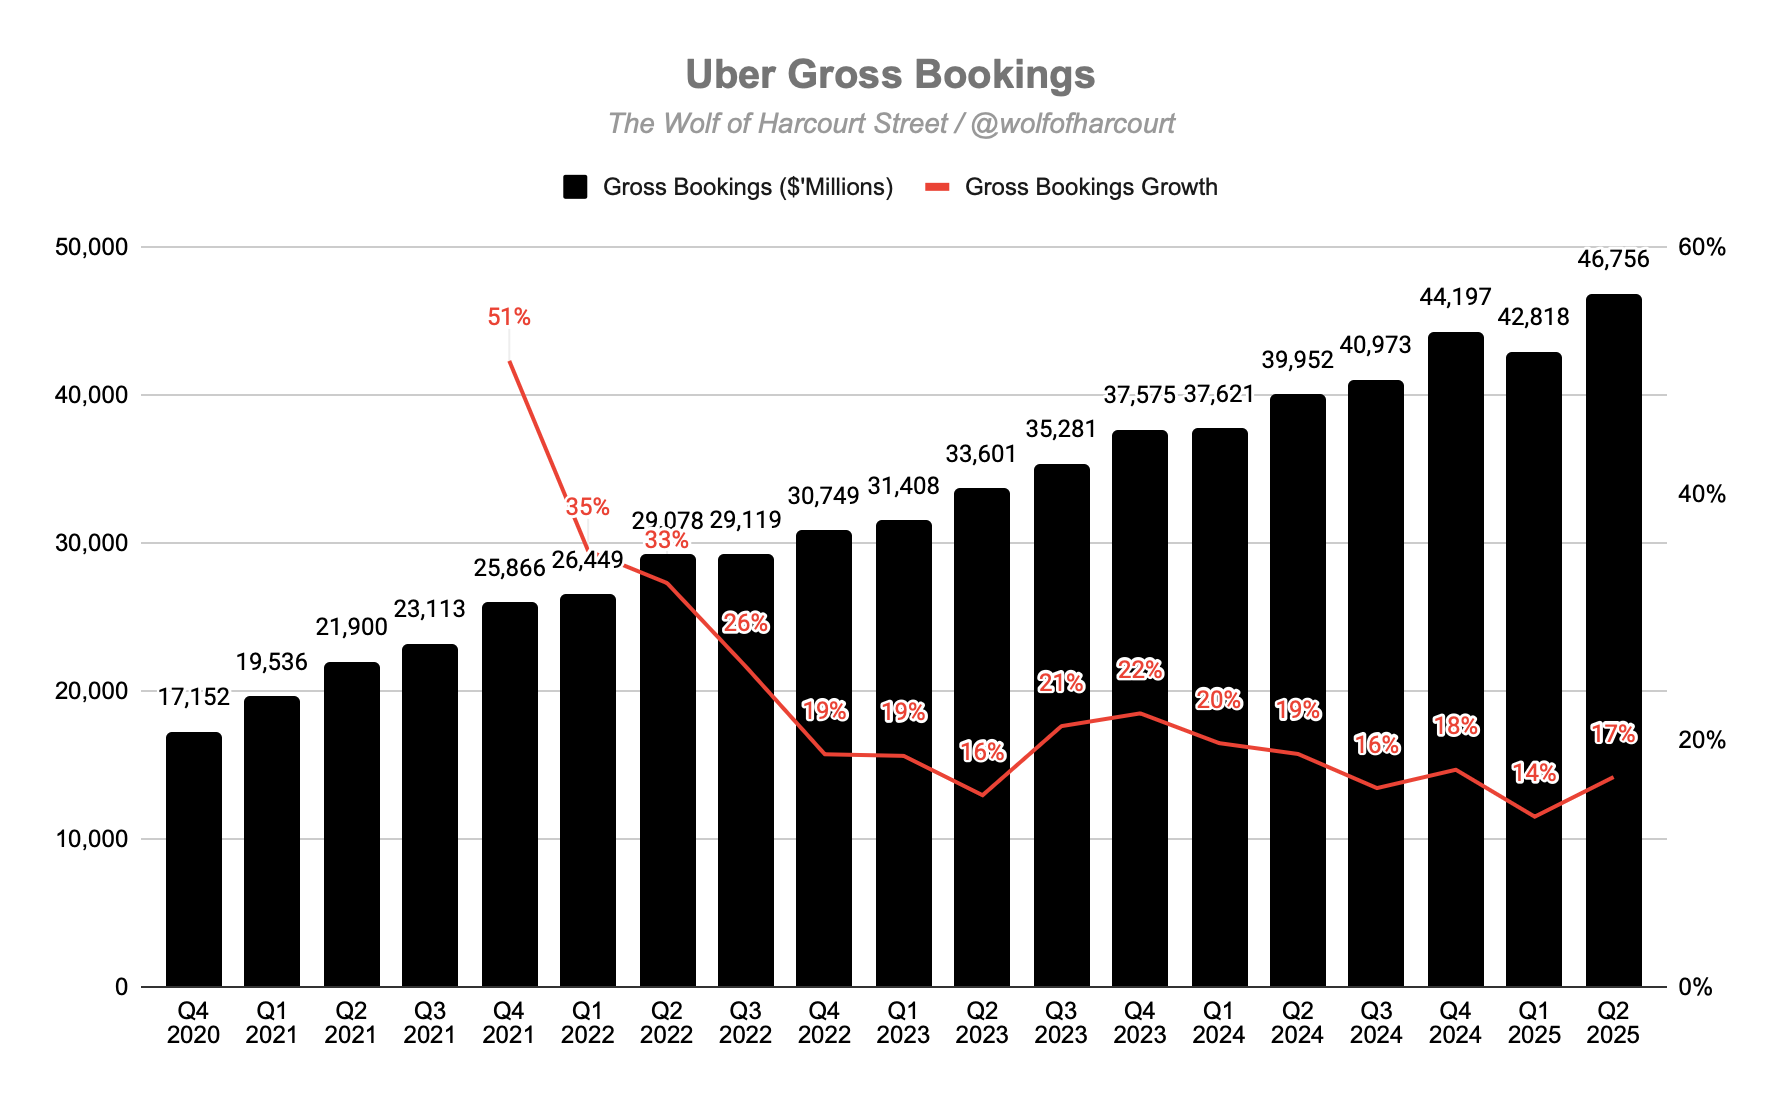
Gross Bookings
Gross Bookings accelerated 17% YoY to $46.8 billion (+18% constant currency), with balanced growth across Mobility and Delivery.
Mobility Segment
Gross Bookings: $23.8 billion (+16% YoY, +18% constant currency)
Take Rate: Above 30% for six straight quarters
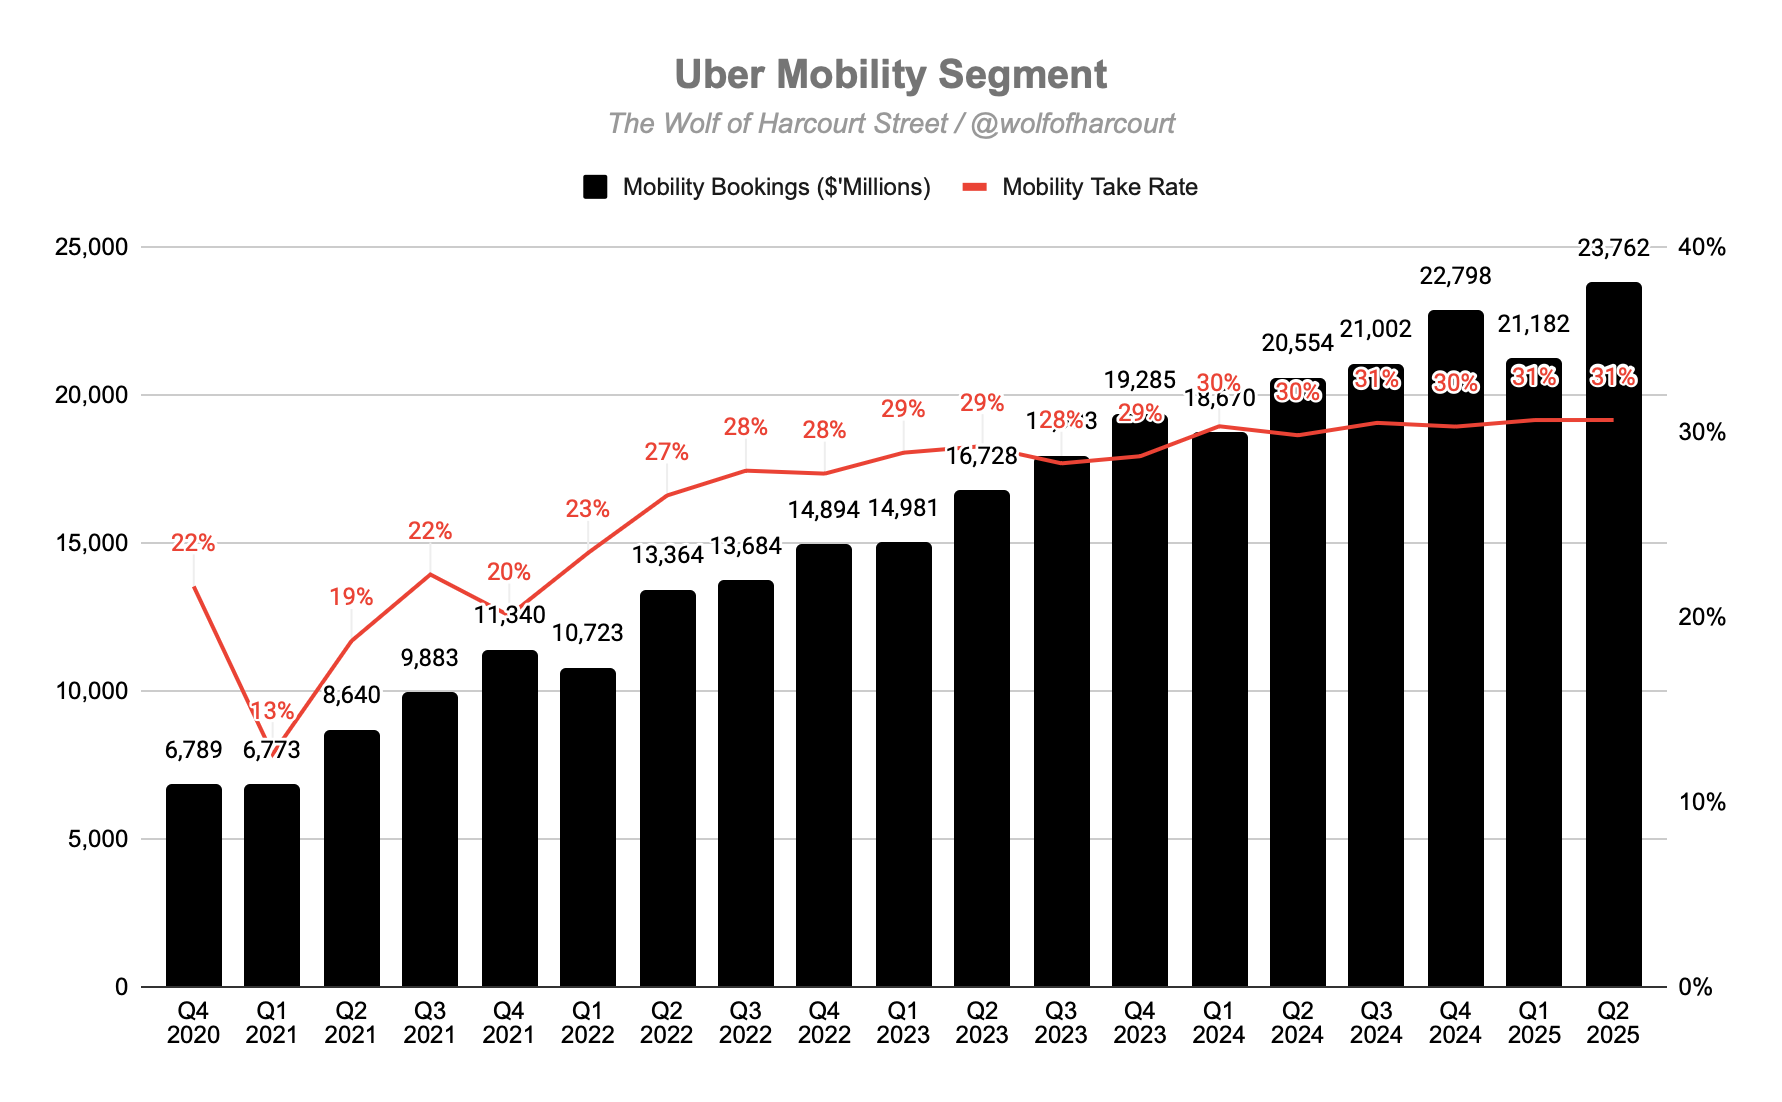
Growth was driven by record engagement and easing price pressures from lower insurance costs, which Uber passed on to customers, boosting re-engagement, especially in the US. US Mobility trip growth is expected to accelerate in Q3.
The Mobility strategy uses a barbell approach:
Affordability: Expanding low-cost modes (two- and three-wheelers, Wait & Save, shared rides) and keeping UberX prices stable through subscription products like Price Lock Pass. Moto bookings now exceed $1.5 billion annually with 40%+ trip growth.
Premium: Comfort, SUV, and Black exceeded $10 billion in annualized Gross Bookings with 35%+ trip growth. Reserve and corporate travel grew nearly 60% and 30%, respectively. Uber is also targeting seniors through simplified accounts and expanding in underpenetrated regions like Europe and the Middle East, where trip growth is near 30%.
Delivery Segment
Gross Bookings: $21.7 billion (+20% YoY)
Take Rate: 19% for the past four quarters
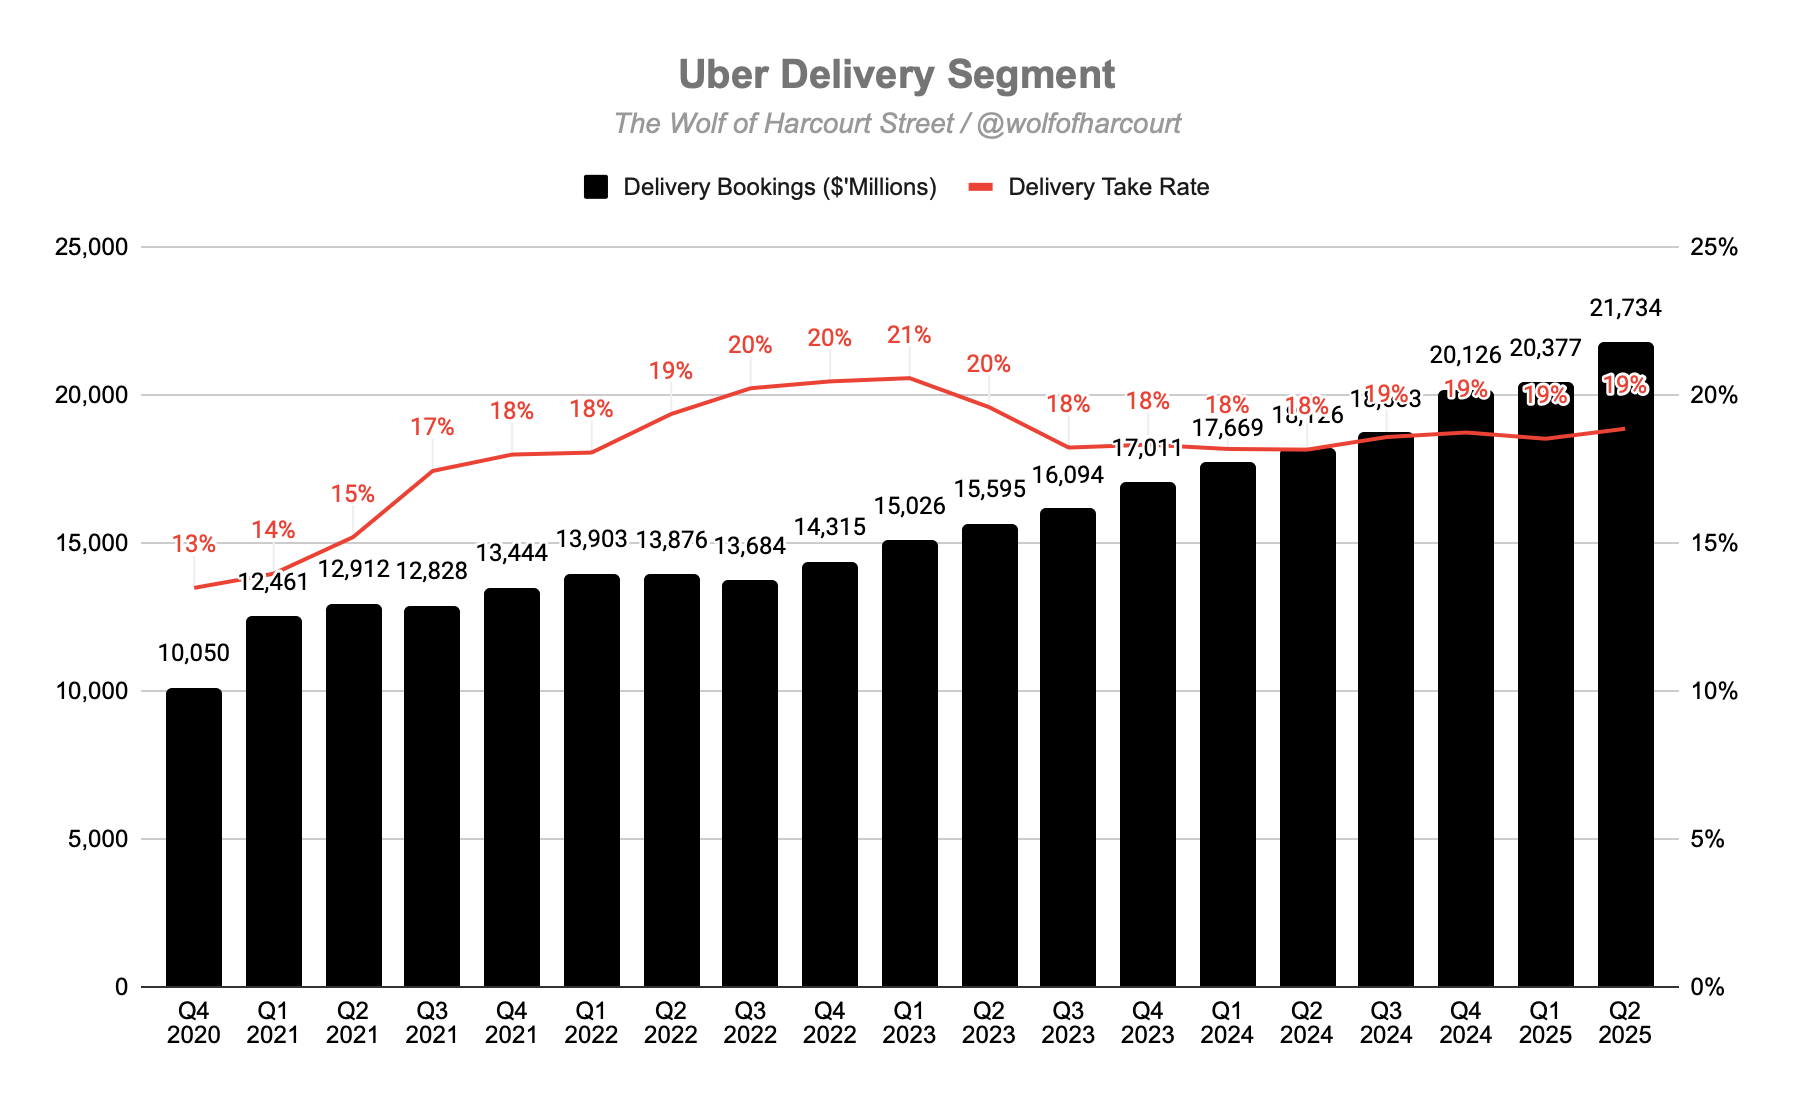
Delivery exceeded expectations, fueled by Uber One adoption and gains in Grocery & Retail (G&R). Selection growth was the fastest in nearly three years, led by the US, Canada, Taiwan, and Japan. Notable US additions included Family Dollar, Five Below, DICK'S Sporting Goods, At Home, and Pet Food Express. Partnerships expanded with Costco (LatAm and APAC), Sobey's (Canada), and Oxxo (Mexico).
Uber holds a top-two position in most of its 30+ countries, with significant upside in user frequency and restaurant delivery penetration. The Uber app drives 30% of first-time Delivery customers and $10 billion in annualized Delivery Gross Bookings. However, around 30% of eligible Mobility riders have never tried Delivery, and 75% have not tried G&R. Uber is also cross-promoting Mobility through the Eats app in Delivery-heavy markets.
Freight Segment
Freight accounts for under 3% of Gross Bookings and has plateaued in recent quarters, with minimal impact on overall results.
4. Financial Analysis
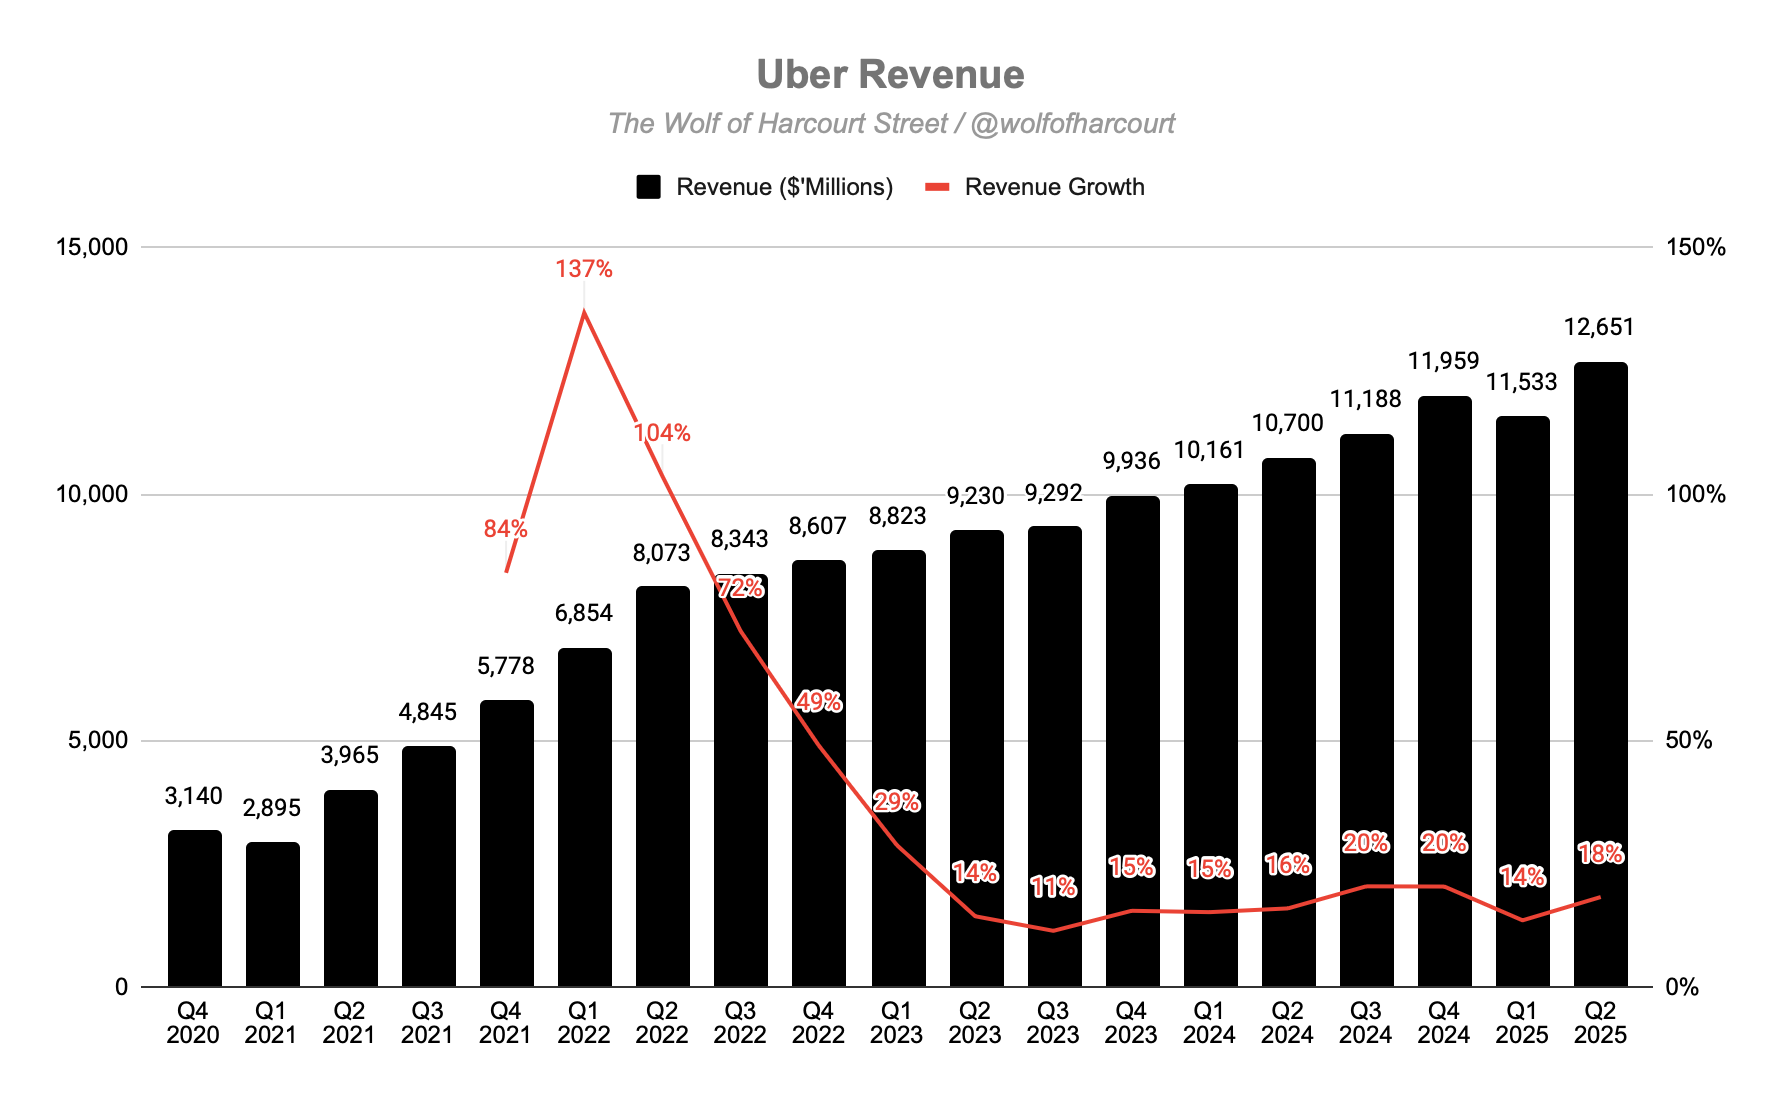
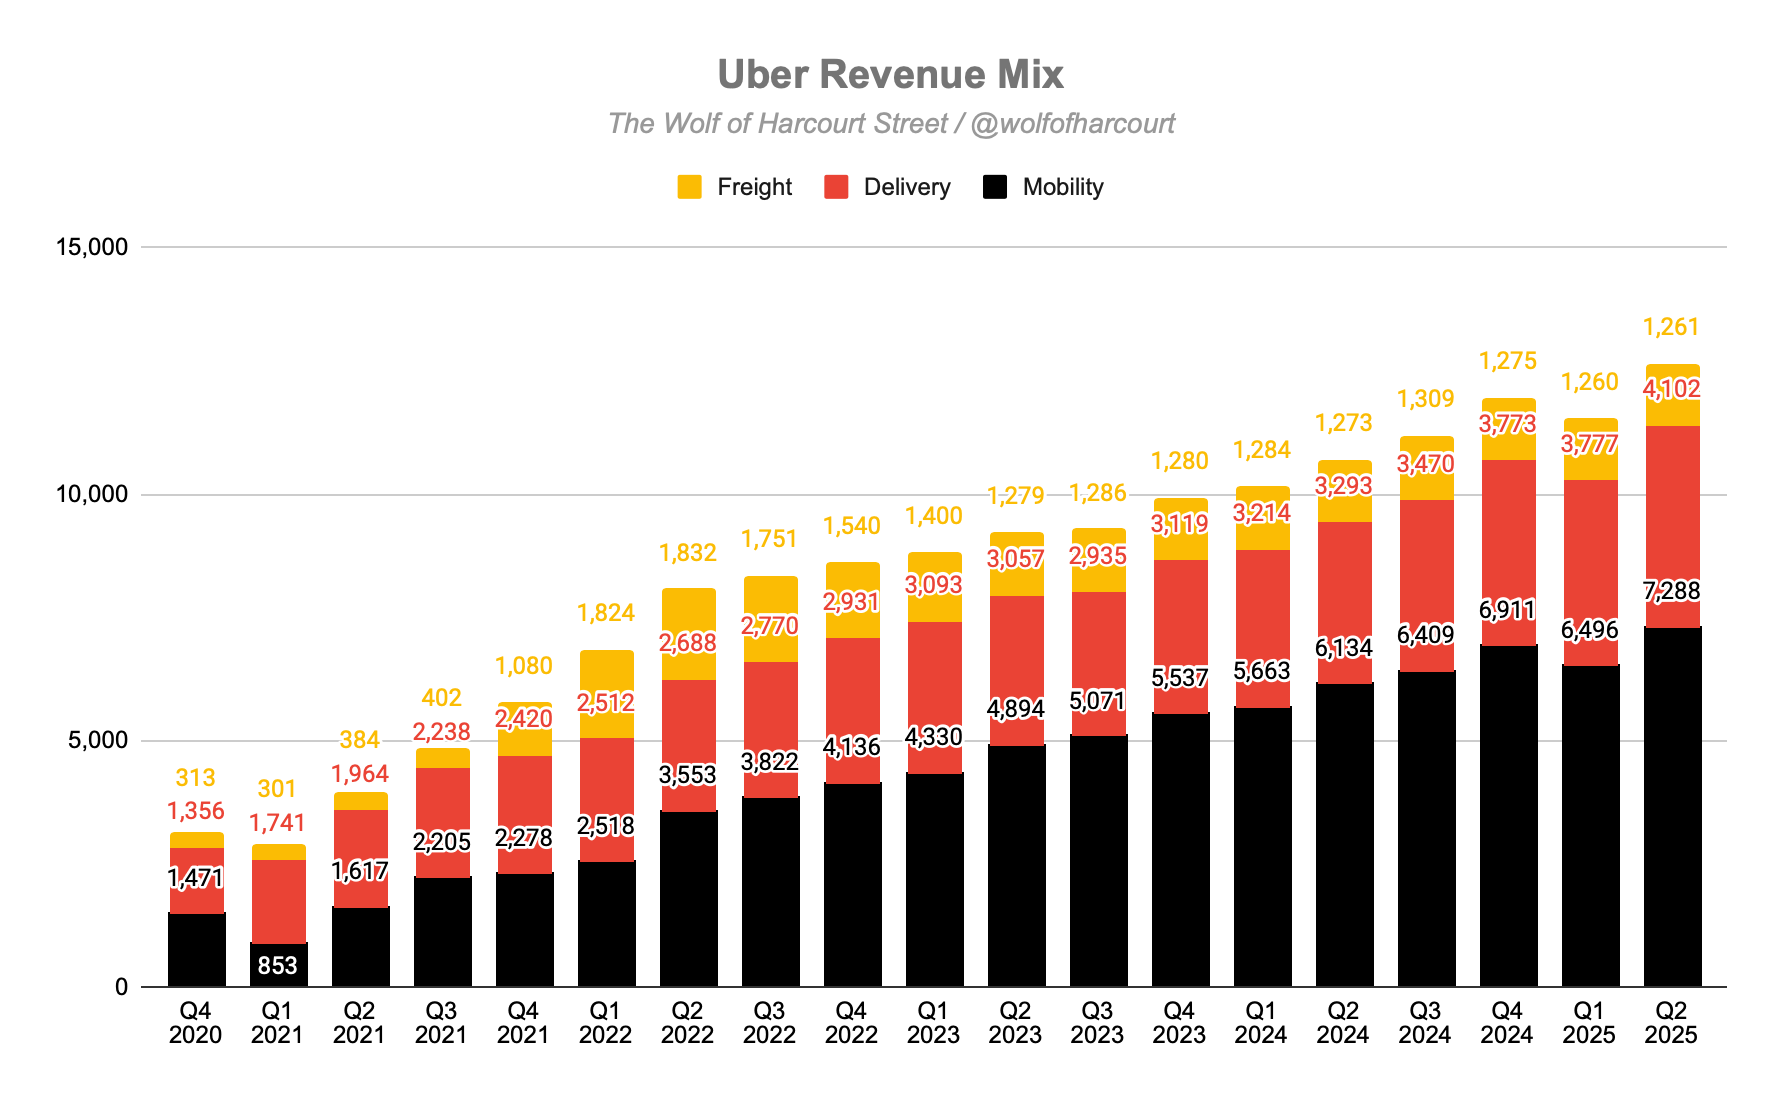
Revenue
Revenue grew 18% YoY to $12.7 billion, accelerating from 14% in Q1 2025. Growth was also 18% on a constant currency basis.
The revenue mix differs from the gross bookings mix due to varying take rates. While Delivery accounted for 47% of gross bookings, it represented only 32% of revenue.
Mobility revenue increased to $7.3 billion, up 19% YoY (18% constant currency), driven by record consumer engagement and slower price growth, aided by moderating insurance pressures.
Delivery revenue grew 25% YoY (23% constant currency) to $4.1 billion. This was the fastest growth rate since Q2 2022, supported by increased membership adoption and strong G&R services growth.
Operating Margin
Uber’s financial transformation continued, with an operating margin of 11%, up from 7% in Q2 2024. Operating income reached a record $1.5 billion, nearly double the prior year.
Sales & Marketing (S&M) remains Uber’s largest operating expense. It includes customer promotions but excludes driver incentives, which are recorded as cost of revenue.
At its peak, Uber spent nearly 40% of revenue on S&M, contributing to high cash burn. This has improved significantly, with S&M now between 9% and 10% of revenue for the past two years.
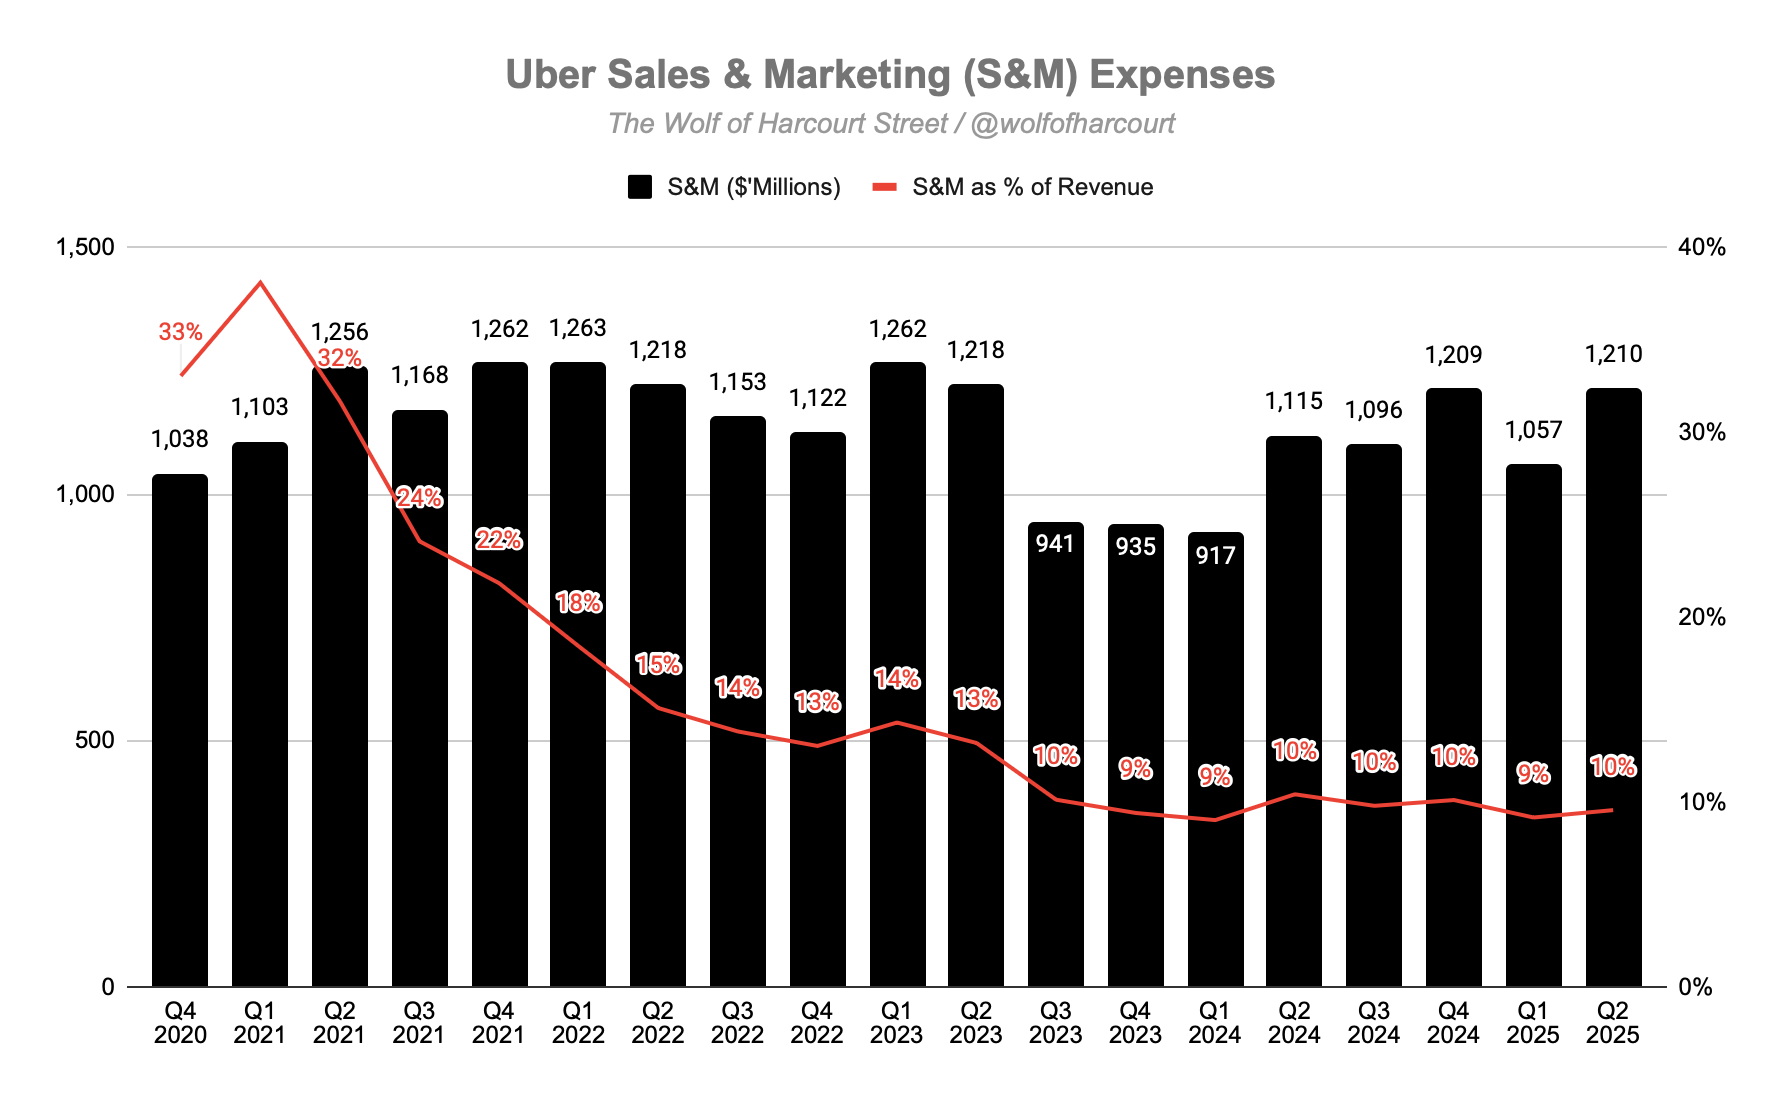
In Q2 2025, an incremental $95 million in S&M spending generated $2 billion in additional revenue, a 20x return on investment. This demonstrates the operating leverage Uber now enjoys, acquiring customers more cheaply by leveraging its platform and driving cross-platform engagement.
Consumers using both Mobility and Delivery are far more valuable, with 35% higher retention and 3x the gross bookings and profits compared to single-service users. This allows Uber to outspend competitors to acquire high-value customers, making acquisition more efficient.
Net Margin
Uber reported net income of $1.4 billion, up from $1.0 billion in Q2 2024. Net margin improved from 10% to 11% YoY. Results included a $17 million pre-tax headwind from equity investment revaluations, compared to a $333 million benefit in Q2 2024.
Cash Flow Analysis
Operating Cash Flow rose 41% to $2.6 billion. Free Cash Flow (FCF) grew 44% to $2.5 billion, with trailing twelve-month FCF hitting a record $8.5 billion, up 80% YoY.
Uber’s asset-light model keeps CapEx low. Despite being one of the largest transportation companies globally, it owns no vehicles. This has driven FCF margin from -10% to +20% in just four years.
Uber holds $6.4 billion in cash and announced a $20 billion share repurchase program. Management maintains a balanced capital allocation approach, reinvesting in growth, making selective acquisitions, maintaining liquidity, and returning excess cash to shareholders. Historically, around 50% of FCF has been allocated to buybacks.
The key difference between FCF margin and operating margin is share-based compensation (SBC). In Q2 2025, SBC was $475 million, up 4% YoY but now appearing to have stabilised. Uber has committed to reducing its share count, already down 1% this quarter.
5. Guidance
For Q3 2025, management expects:
Global trip growth to remain near 19%, with similar pricing trends to Q2. In the U.S., Mobility trip growth should accelerate due to affordability initiatives.
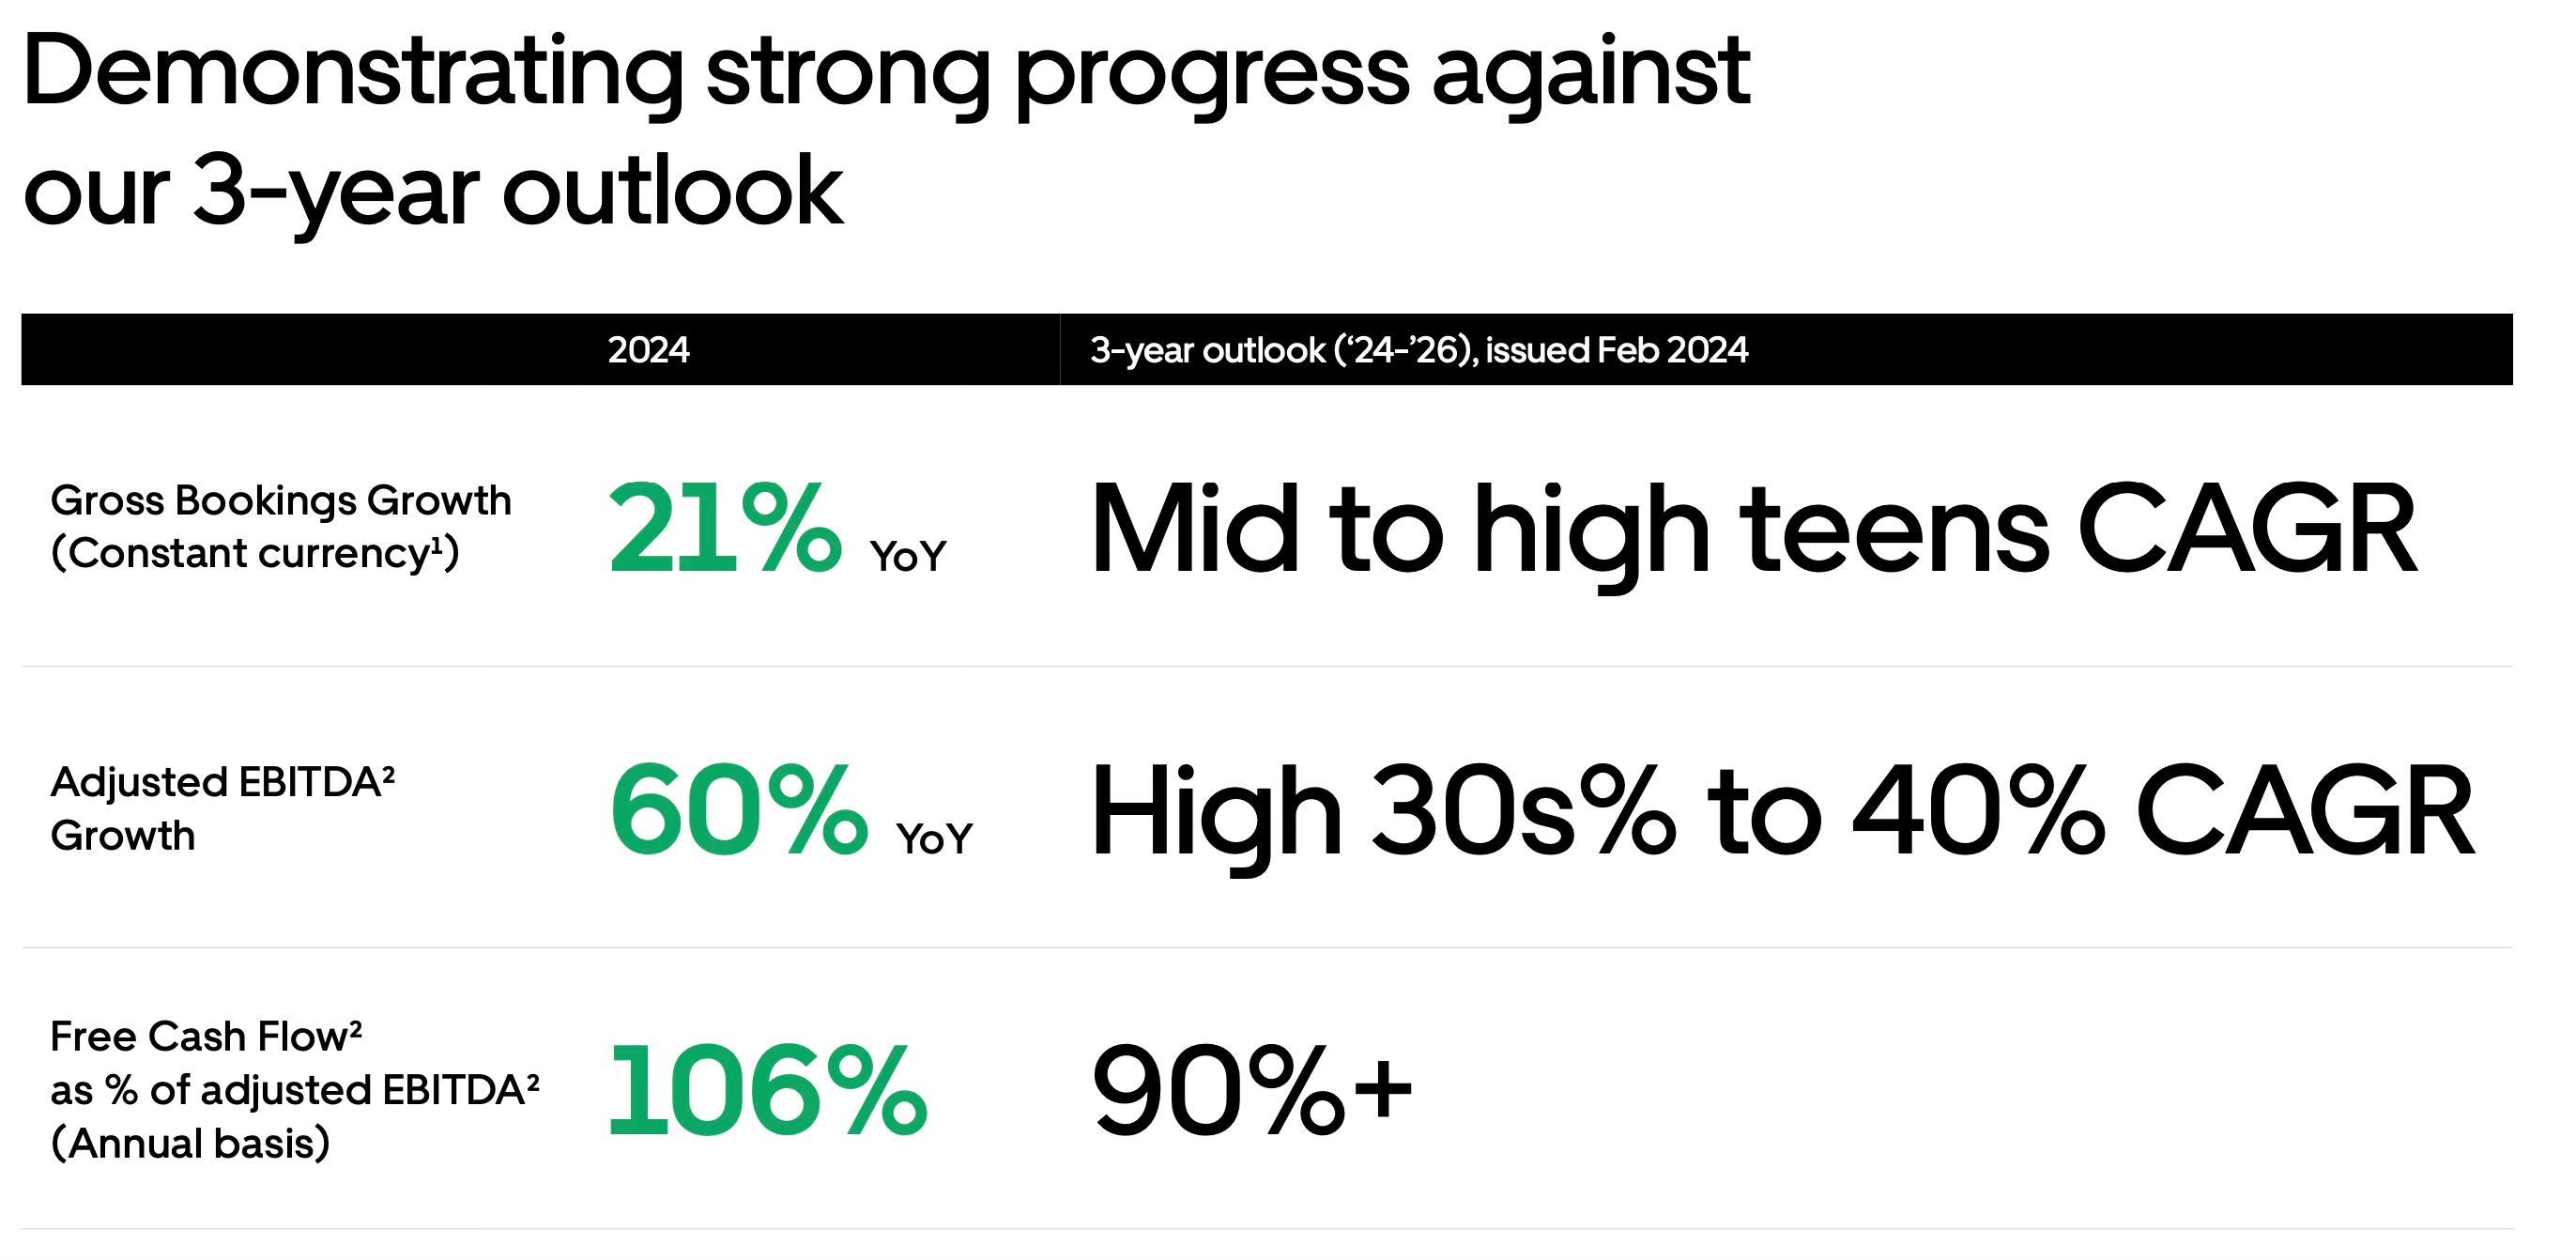
Gross Bookings growth of 17% to 21% constant currency (between $48.25B and $49.75B). Excluding the Trendyol Go acquisition, growth would be 16% to 20%.
Adjusted EBITDA of $2.19B to $2.29B, representing 30% to 36% YoY growth.
This remains well within Uber’s 3-year outlook issued in February 2024.
6. Conclusion
Uber delivered another exceptional quarter with highly profitable growth, driven by record platform audience and frequency. My biggest takeaway is the strength of Uber’s platform strategy for customer acquisition and engagement:
Cross-platform engagement is a major advantage. Consumers who use both Mobility and Delivery services have retention rates more than 35% higher and generate 3x the gross bookings and profits compared to single-service users.
The Uber (rides) and Uber Eats apps function as essentially free acquisition channels. For example, the Eats view within the Uber app generated $10 billion, or 12% of annualised Delivery Gross Bookings, and acquired roughly 30% of first-time Delivery customers.
The Uber One membership program continues rapid growth, with over 36 million members. Members spend 3x more and generate over 40% of combined Delivery and Mobility Gross Bookings.
Uber is also deploying larger, more sophisticated AI models to drive personalised, targeted cross-platform promotions, such as suggesting coffee on the way to work, which improves efficiency and engagement.
The market still views autonomous vehicles (AVs) as Uber’s biggest existential risk. Yet Uber is actively leading AV commercialisation, now partnering with 20 AV companies across Mobility, Delivery, and Freight. New collaborations with Baidu, Lucid, and Nuro were announced this quarter, while Waymo deployments in Austin and Atlanta are outperforming 99% of drivers in daily trip counts. Uber plans to expand OEM partnerships, recognising that while AV software advances quickly, hardware platforms must be built at scale and at lower cost.
Uber positions itself as central to the real-world AI revolution thanks to its unmatched ride-hail dataset, billions of trips across 70 countries, critical for training advanced AV systems. The company is exploring ways to externalise these technical capabilities to help partners.
Uber anticipates three main AV business models on its platform:
Merchant model: Uber pays a predictable fee per trip or day to a partner, taking on monetisation risk.
Agency model: Revenue share, similar to the current driver-partner structure.
Ownership model: Uber or a financing partner owns the vehicles and licenses the software, either monthly or per mile.
In my opinion, CEO Dara Khosrowshahi ranks among the best non-founder CEOs in the public markets. He has delivered strong operating leverage and revenue growth while pursuing bold long-term strategies, including maximising the platform’s potential and leading AV commercialisation. I believe AV adoption will lead to a fragmented market, yet Uber’s distribution network and platform infrastructure remain under-appreciated.
Rating: 4 out of 5. Exceeds expectations.
If you'd like to support the work of an independent analyst, you can buy me a coffee. The proceeds will contribute to covering the annual running costs of the newsletter.
Join the community of informed investors – subscribe now to receive the latest content straight to your inbox each week and never miss out on valuable investment insights.
The Chat is a space designed to facilitate, real-time discussions, share knowledge and debate ideas with fellow investors. Join the conversation.

If you found today's edition helpful, please consider sharing it with your friends and colleagues on social media or via email. Your support helps to continue to provide this newsletter for FREE!
Happy investing
Wolf of Harcourt Street
Contact me
Twitter: @wolfofharcourt
Email: wolfofharcourtstreet@gmail.com
Wonderful, thank you for this piece.