

Executive Summary
Uber's MAPCs reached 171 million, growing 14% YoY, marking the largest quarterly increase since pre-COVID. Trip growth outpaced MAPC growth, at 18% YoY, totalling 3.1 billion trips or 33 million per day, leading to a record-high 6 trips per MAPC per month. User engagement is on the rise, with multi-product adoption at 37%. Uber One membership surged 60% YoY to 30 million members, though penetration remains at 18%, signalling further growth potential.
Revenue grew 20% YoY to $12.0 billion, continuing strong growth after two consecutive quarters of acceleration. Mobility revenue rose 25% YoY and 8% QoQ, driven by higher gross bookings from increased trip volumes. Delivery revenue grew 21% YoY and 9% QoQ, supported by rising trip volumes and higher ad revenue. Notably, Delivery has rebounded from just 4% growth in Q1 2024, accelerating for three consecutive quarters.
Uber’s operating margin remained positive at 6% in Q4 2024, slightly down from 7% in the previous year. This decline was not driven by Sales & Marketing expenses, which have become significantly more efficient—now at 10% of revenue, compared to nearly 40% at their peak. Instead, the drop was due to a sharp rise in General & Administrative costs, which more than doubled due to legal settlements, including a $271.8 million class-action lawsuit in Australia. Excluding these legal costs, Uber’s operating margin would have been 10%.
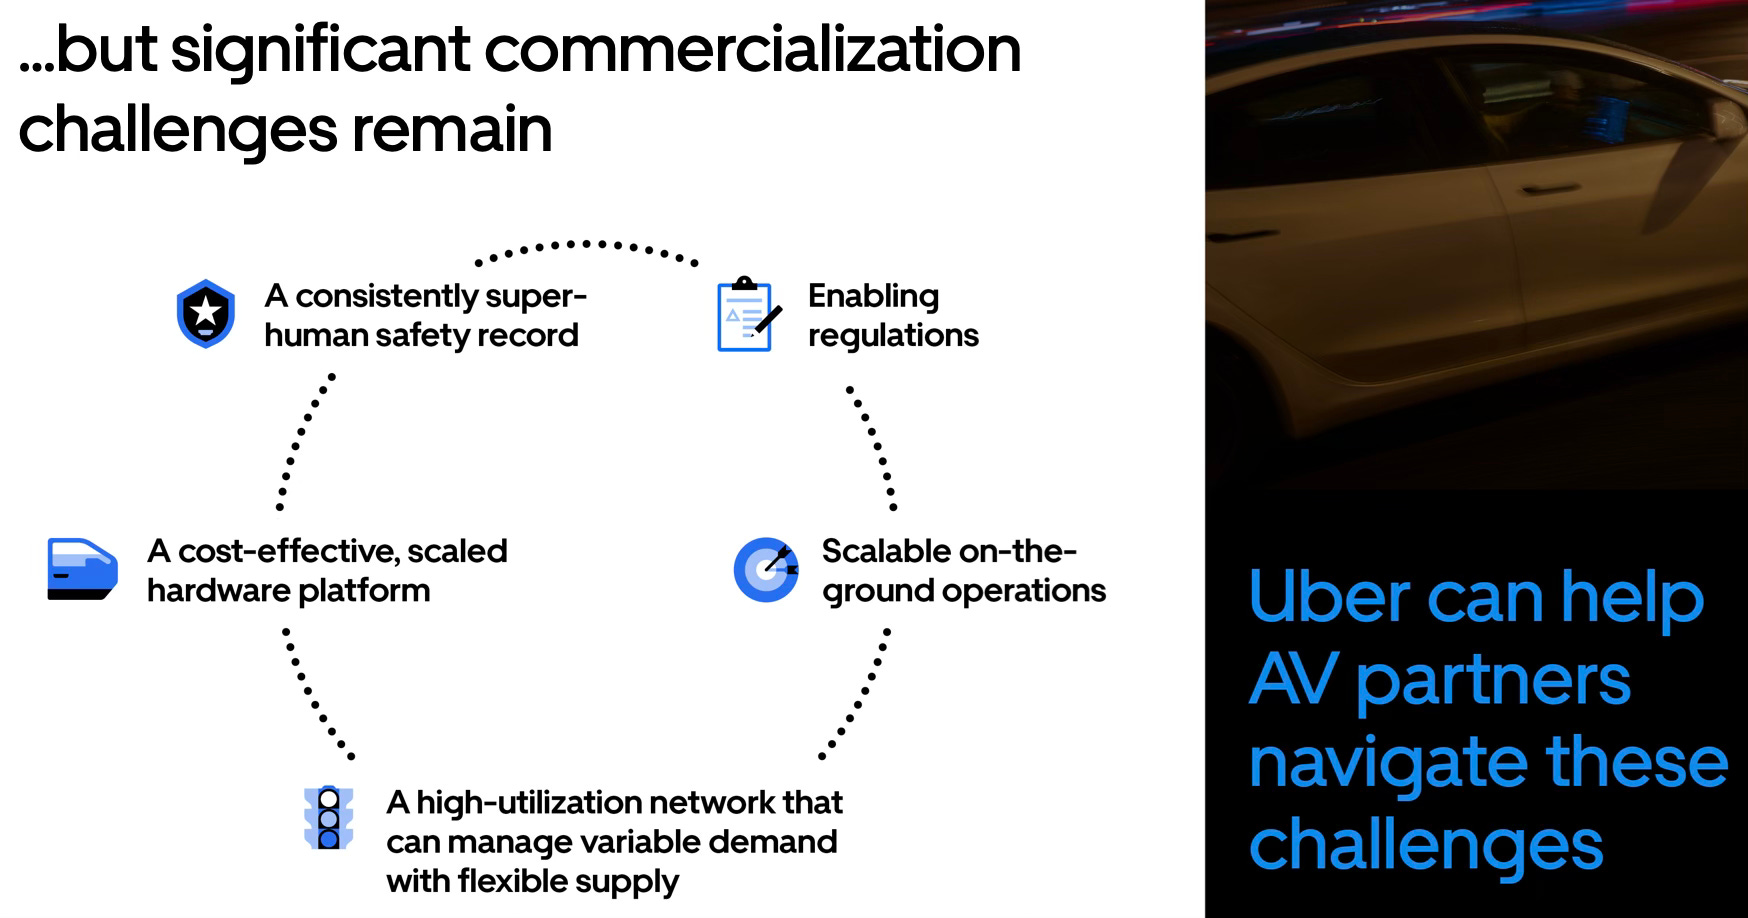
While the market narrative suggests that AV technology poses an existential threat, Uber argues that widespread commercialisation remains distant. Management outlines five key hurdles: regulatory alignment, superhuman safety standards, cost reductions in hardware, efficient fleet operations, and high-utilization networks. They believe Uber is well-positioned, treating AVs as a strategic priority, with AV fleet supply already comprising 15% of inventory. This week, Uber announced an Austin pilot with Waymo, reflecting ongoing investment. While AV adoption will grow, the market will likely resemble the evolution of generative AI, with multiple global players emerging over time.

Contents
Financial Highlights
Wall Street Expectations
Business Activity
Financial Analysis
Guidance
Conclusion
1. Financial Highlights
Revenue: $11.96 billion (+20% YoY)
Mobility: $6.91 billion (+25% YoY)
Delivery: $3.77 billion (+21% YoY)
Freight: $1.28 billion (+0% YoY)
Operating Income: $770 million (+18% YoY)
Net Income: $6.88 billion (+382% YoY)
Adjusted EBITDA: $1.84 billion (+44% YoY)
2. Wall Street Expectations
Revenue: $11.78 billion (beat by 2%)
EPS: $0.48 (beat by 569%)
3. Business Activity
Monthly Active Paying Customers (MAPCs)
Uber reported 171 million MAPCs, a 14% increase from the same period in 2023, with sequential acceleration. The company added 10 million new MAPCs during the quarter—the largest increase since pre-COVID.

Trips
Trip growth also accelerated, increasing 18% YoY to 3.1 billion. Uber completed an average of 33 million trips per day during the quarter.

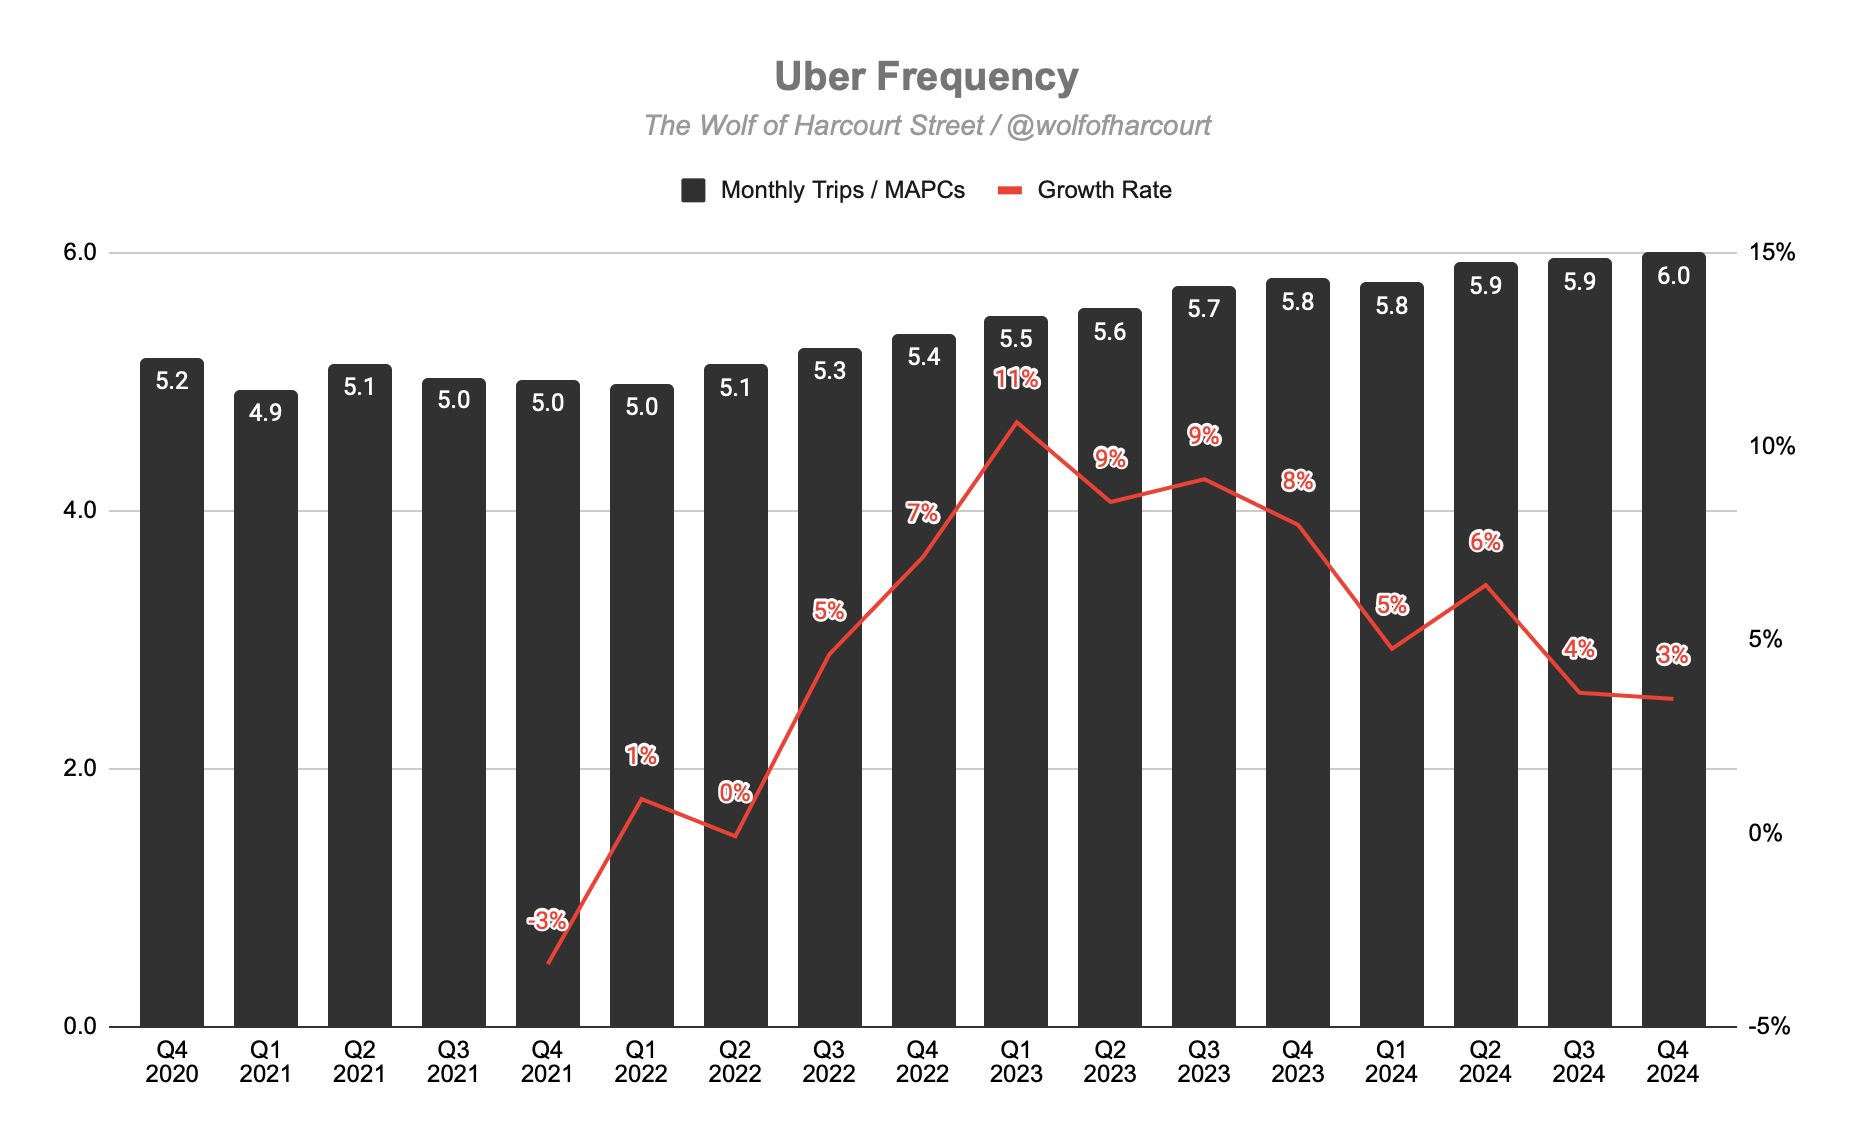
Frequency
The faster growth in Trips relative to MAPCs resulted in a 3% YoY increase in monthly trips per MAPC, reaching 6 trips per month, a new all-time high. This trend suggests rising user engagement and satisfaction, with multi-product usage also hitting an all-time high at 37% of Uber consumers.
Membership
A key driver of increased frequency and retention is the Uber One membership program, which grew 60% YoY to 30 million members. With Uber One penetration still at just 18% of MAPCs, the growth opportunity remains substantial. During the quarter, Uber One expanded into six new countries, bringing the total to 34, covering all Uber Delivery markets.
Gross Bookings
Gross Bookings growth accelerated 18% YoY to $44.2 billion (+21% on a constant currency basis), exceeding management's high-end guidance.

Mobility Segment
Gross Bookings: $22.8 billion (+18% YoY, +24% constant currency)
Take Rate: Above 30% for all of 2024

Growth Initiatives
Affordability Focus – Expanded UberX Share to major airports and increased Uber Shuttle services.
Uber for Teens Growth – Expanded to 26 new countries, now covering 50+ countries, with new Teen Profilesenabling independent payments.
Corporate Segment Expansion – Launched Uber Business Black in the U.S., U.K., and Brazil, targeting premium corporate travelers.
Taxi Integration – Partnered with Japanese operators to add 20,000 taxis to the platform.
Uber Courier Enhancement – Rebranded and introduced Saver and scheduling features for improved delivery options..
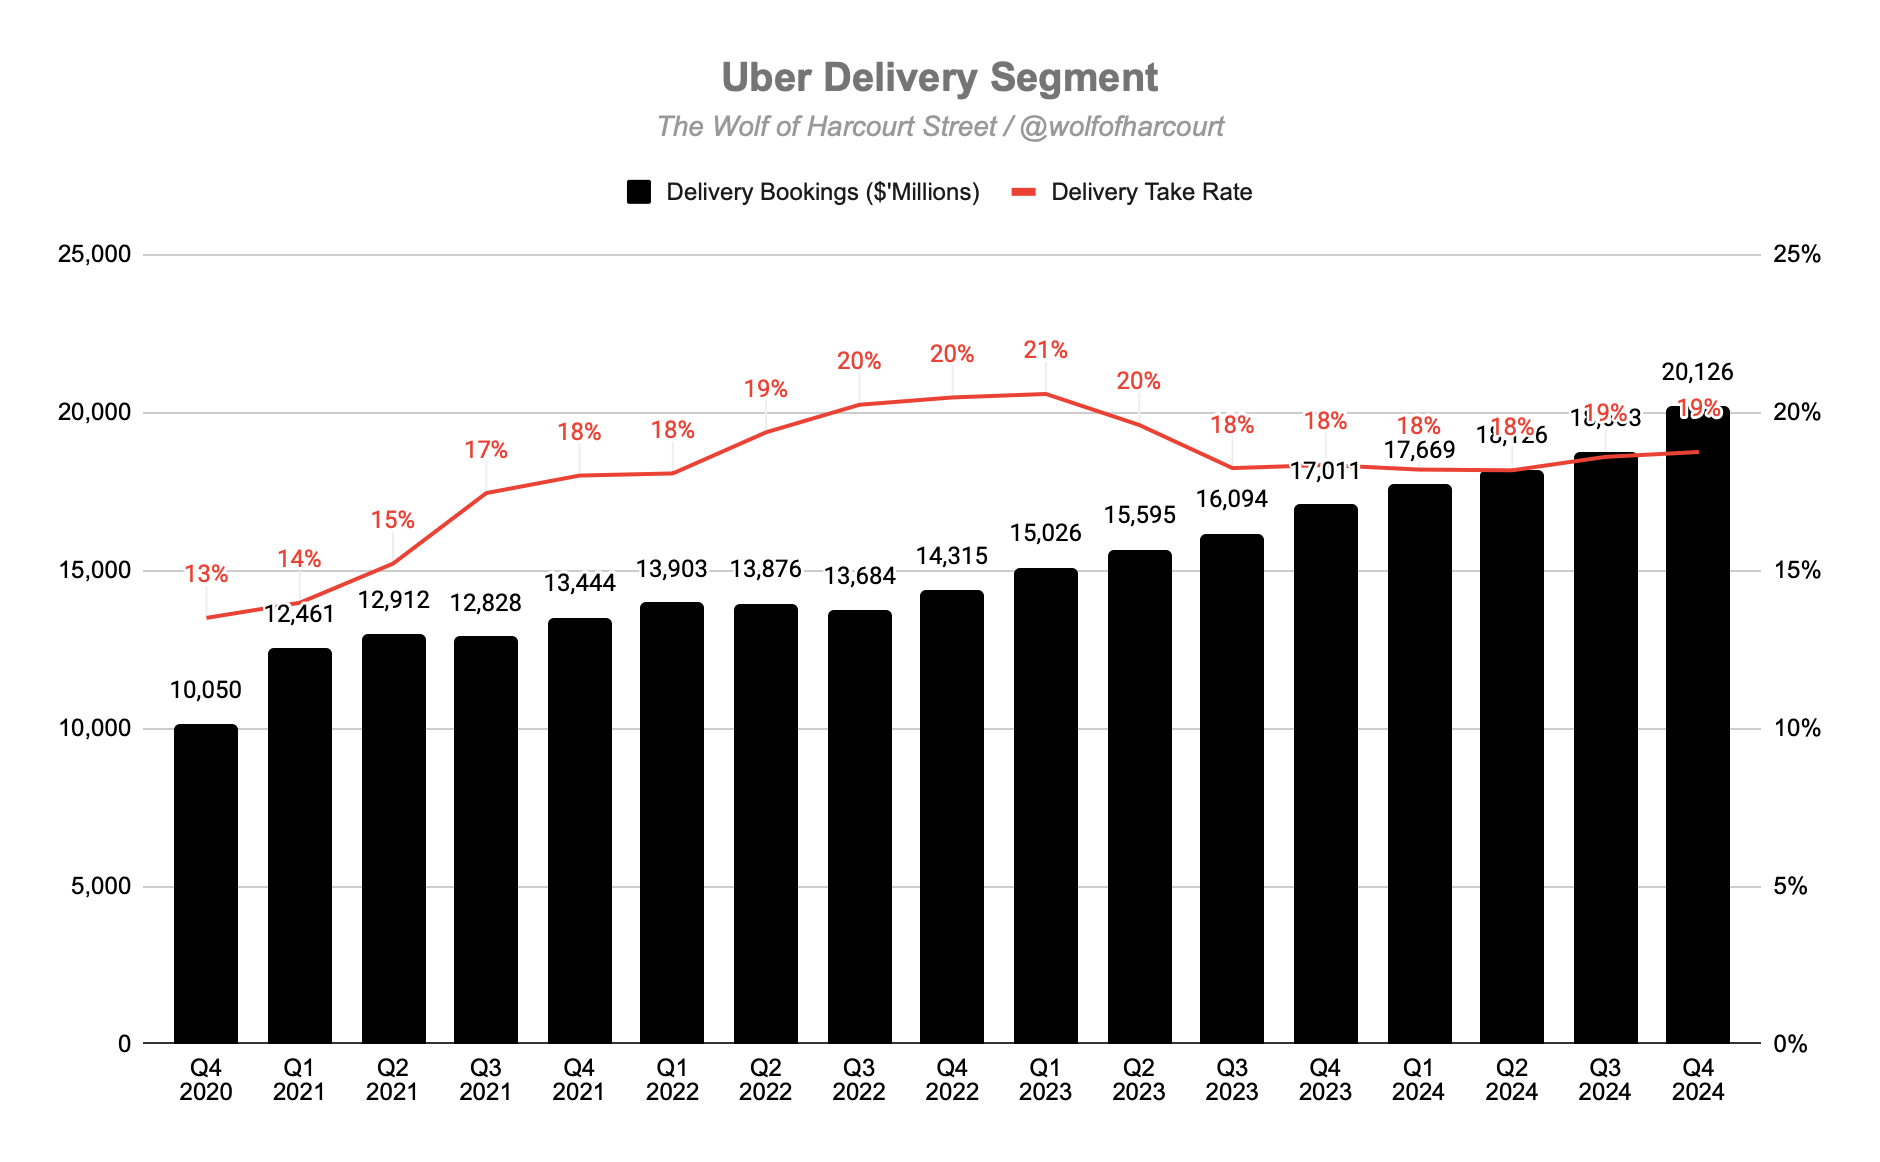
Delivery Segment
Gross Bookings: $20.1 billion (+18% YoY)
Take Rate: 19% for the past two quarters
Success in Delivery relies on three key factors:
Selection – Uber now has 1 million+ active merchants (+16% YoY), with increasing sales per merchant.
Price – Merchant-funded discounts are at an all-time high, helping boost visibility through Uber’s ranking algorithm.
Quality – Continued improvements in defect rate, ensuring flawless deliveries.
Growth Initiatives
SNAP EBT Payment Acceptance – Enabled SNAP EBT benefits for grocery orders via Uber Eats in the U.S.
Uber Direct Expansion – Strengthened partnerships with Toast Delivery Services, P.F. Chang’s (U.S.), Burger King (U.K.), Bunnings (Australia), and Media Markt (Poland).
Grocery & Retail Fulfillment Enhancements – Launched Shopper Pick & Pack, improved order redirection, and integrated fulfillment tech for merchants.
Festive Holiday Features – Introduced a holiday shopping hub, Christmas tree delivery, and Uber Carolers to drive seasonal demand.
Freight Segment
Freight accounts for less than 3% of total Gross Bookings and has plateaued over recent quarters. Given its limited impact on overall results, further details are not necessary.
4. Financial Analysis
Revenue
Revenue grew 20% YoY to $12.0 billion, or 21% on a constant currency basis. After accelerating for two consecutive quarters, it's positive to see growth remain at 20%.

The revenue mix differs from the gross bookings mix due to varying take rates. While Delivery accounted for 45% of gross bookings in Q4, it represented only 32% of revenue.

Mobility revenue grew 25% YoY and 8% quarter-over-quarter (QoQ). The YoY increase was driven by higher Mobility Gross Bookings, reflecting an increase in Trip volumes.
Delivery revenue grew 21% YoY and 9% QoQ. The YoY increase was primarily driven by higher Delivery Gross Bookings, due to an increase in Trip volumes and higher advertising revenue. After bottoming at just 4% growth in Q1 2024, Delivery has accelerated for three consecutive quarters.

Operating Margin
Uber’s transformation from a cash-burning startup to a profitable enterprise continued this quarter, posting an operating margin of 6%, despite a slight decline from 7% in Q4 2023.

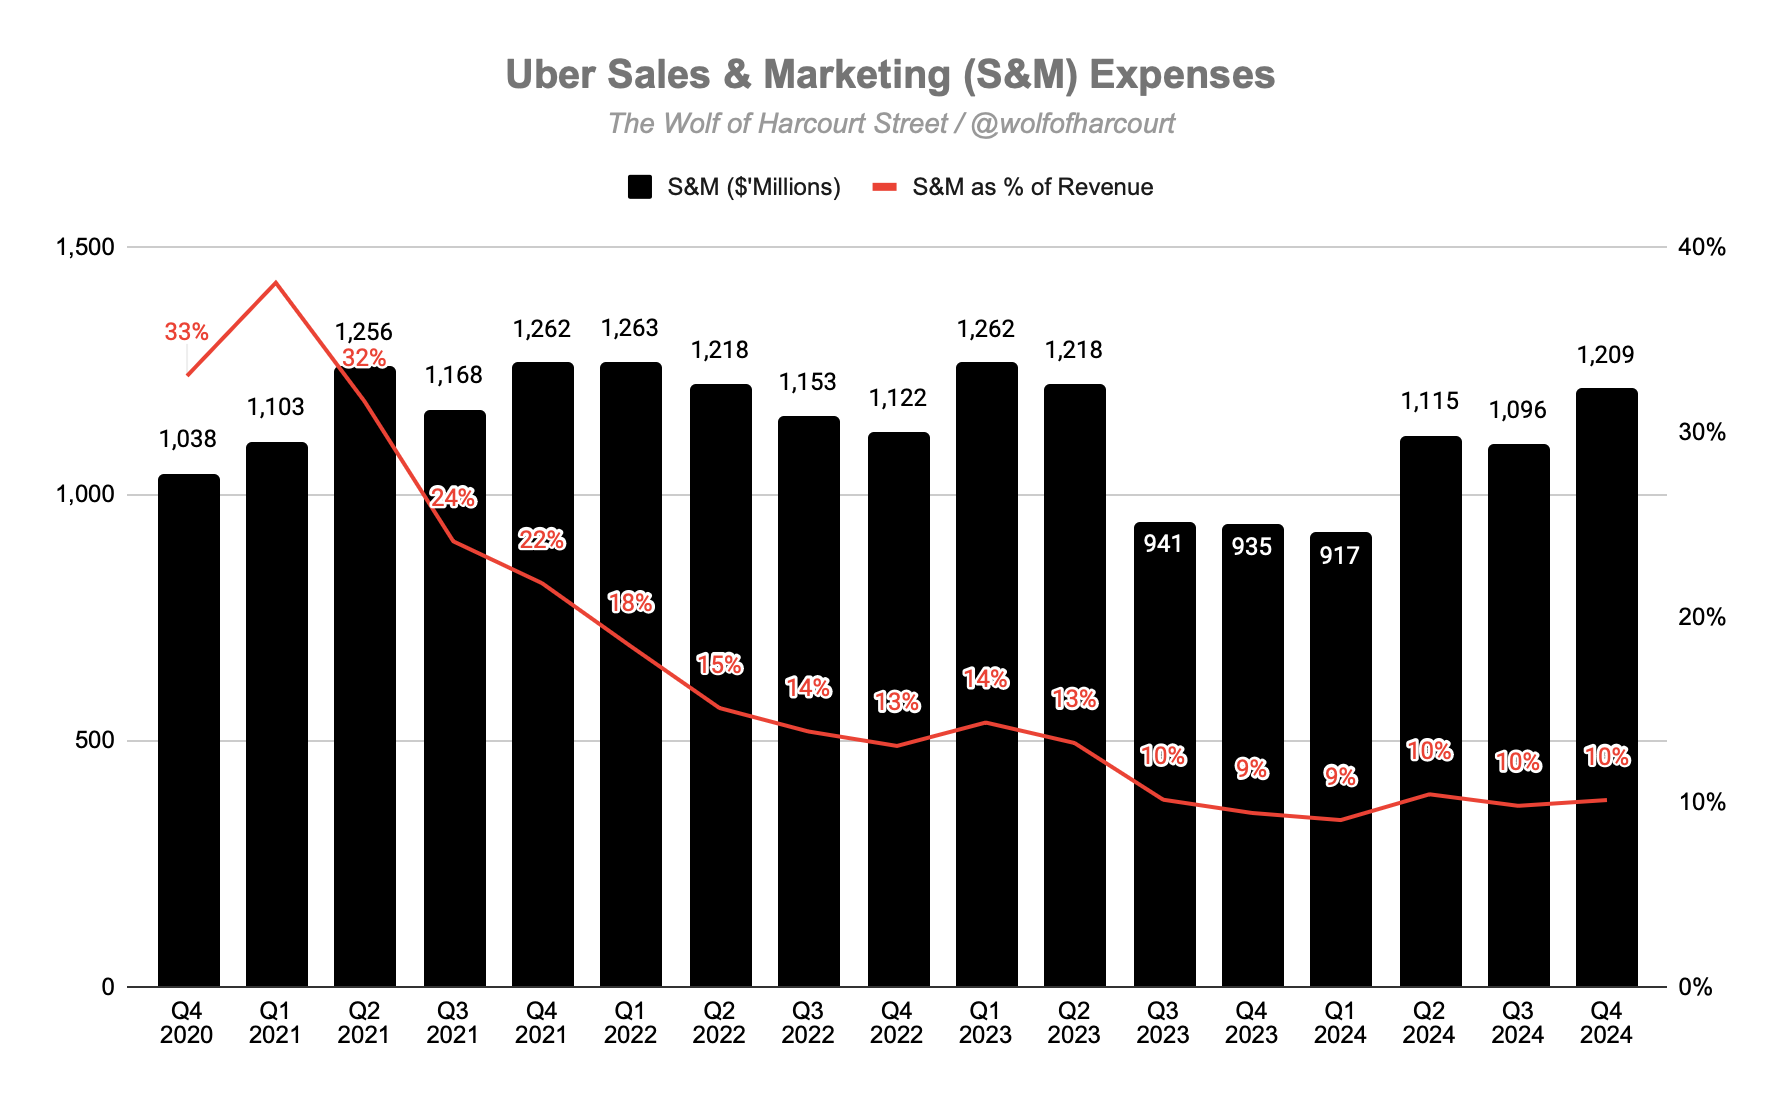
Sales & Marketing (S&M) remains Uber’s largest operating expense and includes customer promotion spend. Notably, this does not include driver incentives, which are separate payments made to drivers on top of their share of fares. Driver incentives are recorded as a cost of revenue, not as an operating expense.
At its peak, Uber was spending nearly 40% of revenue on S&M, contributing to its high cash burn. However, this trend has improved significantly over the past few years, with S&M expenses now at 10% of revenue in Q4.
Analyzing S&M efficiency, an incremental $275 million in S&M spending in Q4 2024 (compared to Q4 2023) resulted in $2 billion of incremental revenue—a strong return on investment.
If S&M did not drive the 1% decline in operating margin, then what did? The answer: General & Administrative (G&A) expenses, which increased from $603 million to over $1.1 billion. This was driven by legal and regulatory reserve changes and settlements, including a $271.8 million settlement for a class-action lawsuit in Australia (without admission of liability). These costs stem from events between 2014 and 2017 and are not related to recent operations.
Excluding legal costs, Uber’s operating margin in Q4 would have been 10%.
Net Margin
Net income surged to $6.9 billion, up from $1.4 billion in Q4 2023, benefiting from:
A $6.4 billion tax valuation release
A $556 million net unrealized gain from Uber’s equity investments
However, given the one-off nature of these items, net income is not a reliable metric for assessing Uber’s profitability. Instead, Operating Income or Free Cash Flow (FCF) should be used.
Cash Flow Analysis
Uber recorded Operating Cash Flow of $1.8 billion and FCF of $1.7 billion, resulting in a 14% FCF margin, up from 8% a year ago.
Uber’s CapEx needs remain extremely low due to its asset-light model. Despite being one of the world’s largest transportation companies, Uber does not own any vehicles. This enables a strong FCF trend, moving from a -30% margin to +14% in just four years.

Uber currently holds $5.9 billion in cash, prompting a $1.5 billion accelerated share repurchase agreement in January, as part of a previously announced $7.0 billion buyback authorisation.
The key difference between FCF margin and operating margin is share-based compensation (SBC). In Q4, Uber incurred $419 million in SBC, down from $469 million a year ago, though it still accounts for a quarter of FCF. While excessive SBC is a common concern for tech stocks, it is positive to see Uber reducing this over time.
5. Guidance
For Q1 2025, management expects:
Gross Bookings growth of 17% to 21% YoY on a constant currency basis, translating to reported Gross Bookings of $42.0 billion to $43.5 billion. The outlook assumes a 5.5 percentage point currency headwind.
Adjusted EBITDA of $1.79 billion to $1.89 billion, reflecting 30% to 37% YoY growth.
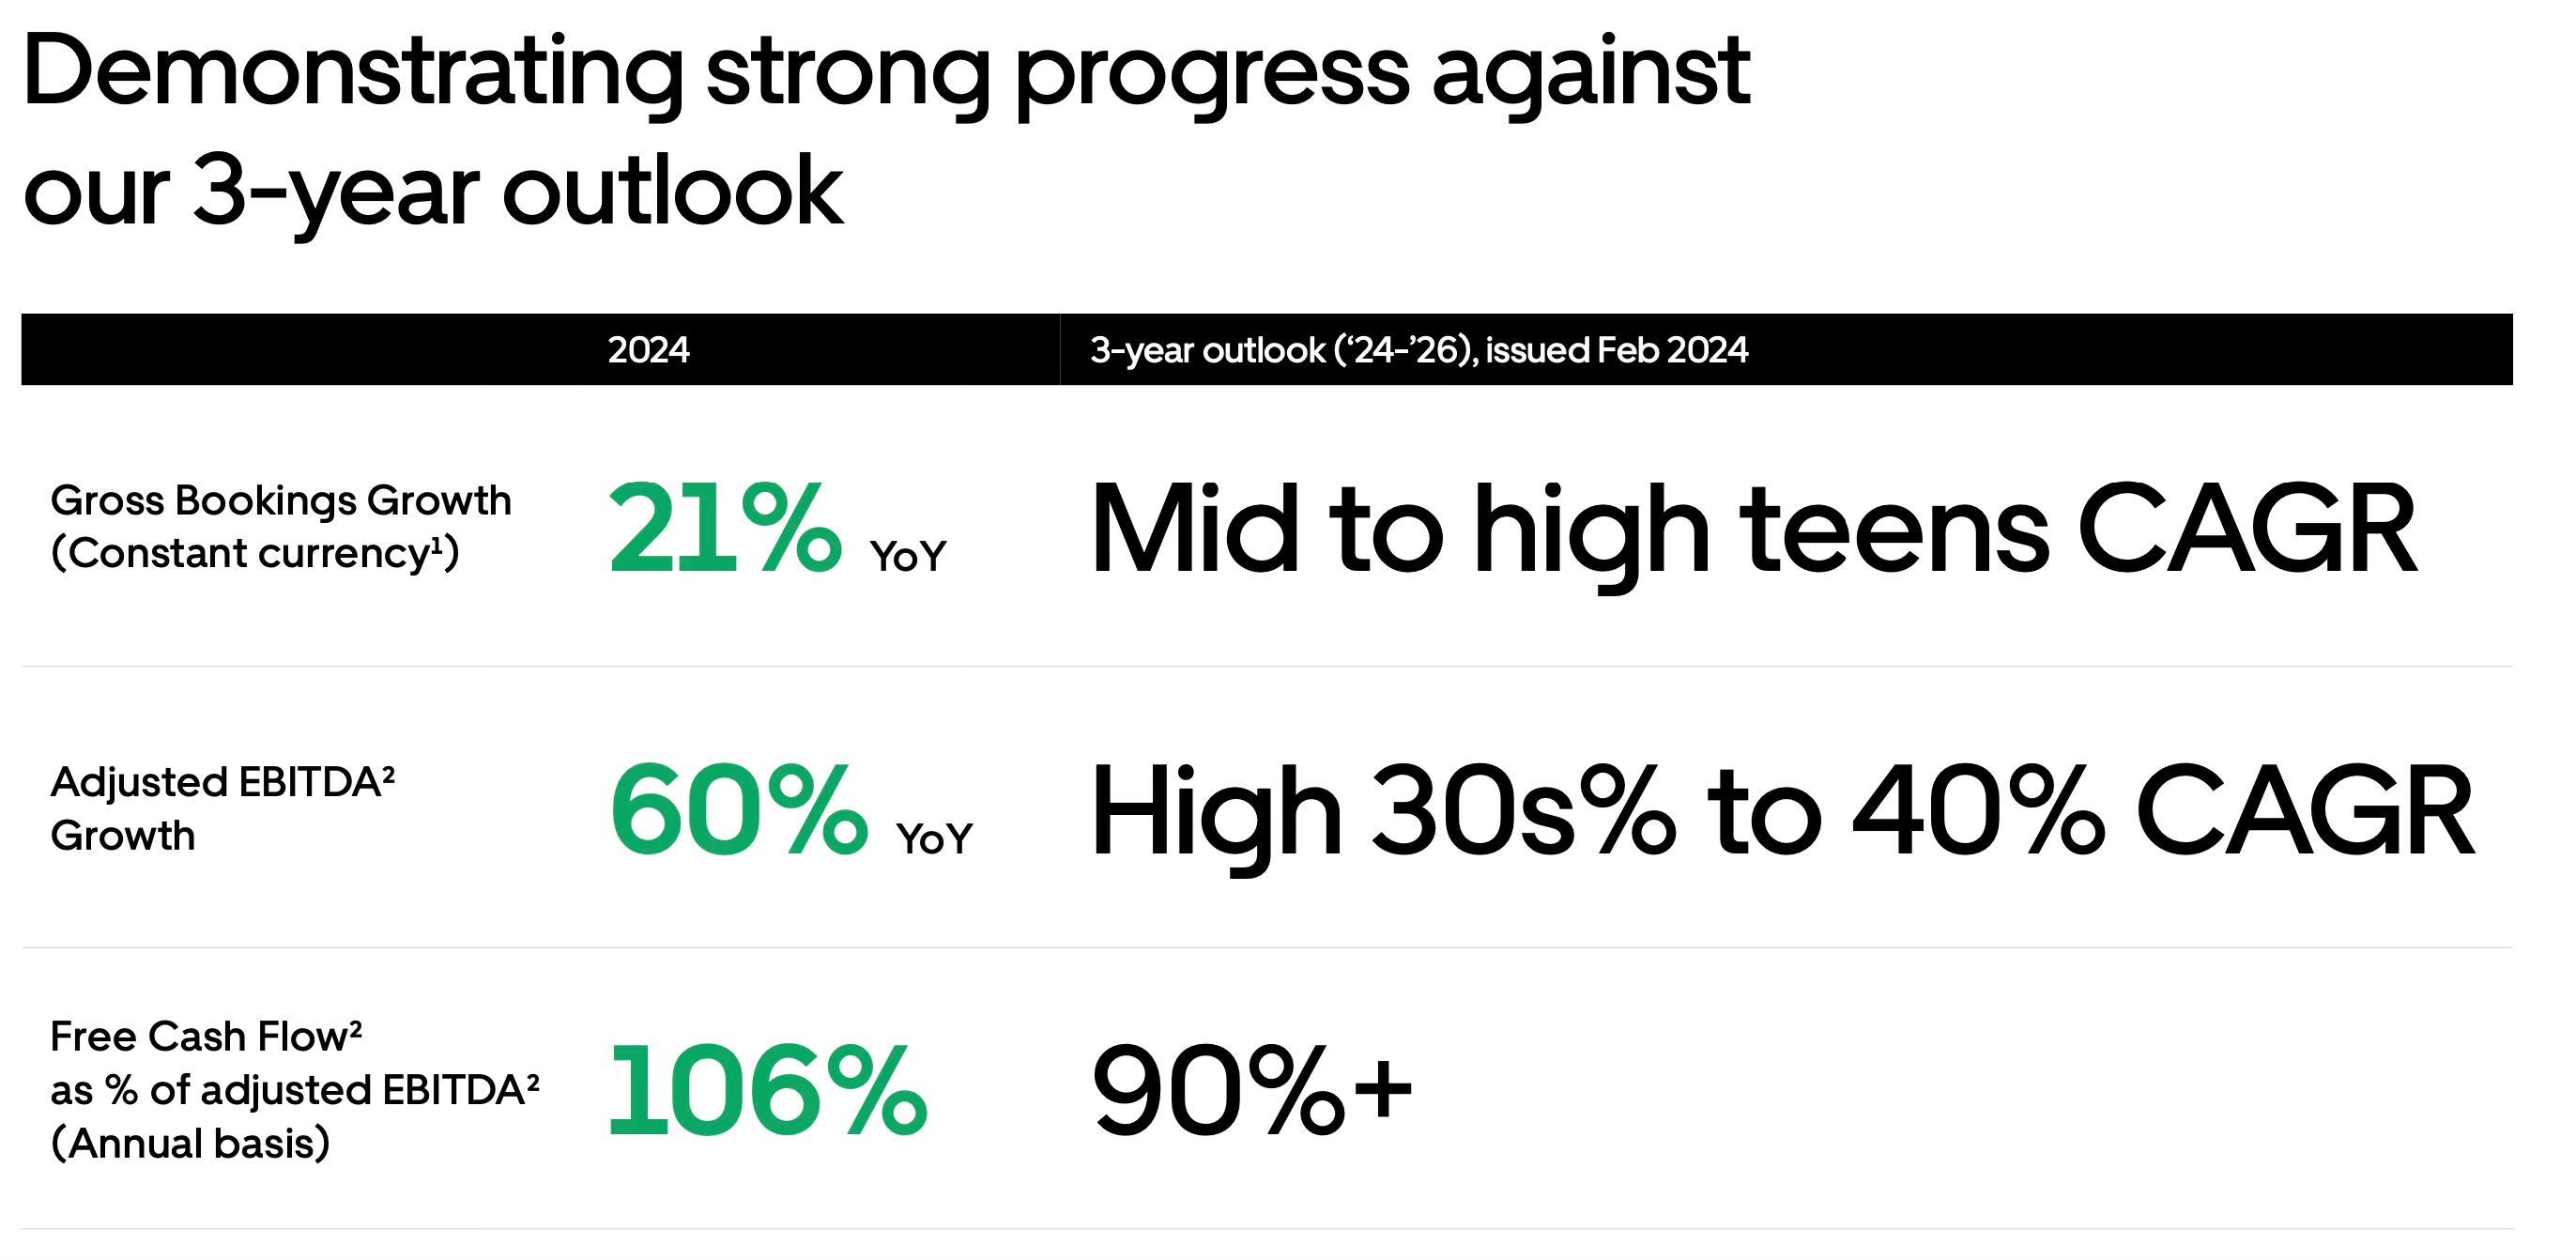
Notably, this guidance remains well within Uber’s 3-year outlook, issued in February 2024.
6. Conclusion
Operating metrics drive financial performance, and this quarter was one of Uber’s strongest ever, with growth accelerating across MAPCs, trips, and Gross Bookings. The Uber platform's value proposition is clearly resonating with customers, as Uber One membership has reached 30 million.
CEO Dara Khosrowshahi deserves significant credit for transforming Uber from a money pit into a cash cow in recent years. Evaluating management strength is challenging for investors, but one approach is to compare past statements with present execution. Last year, Uber laid out a three-year outlook, and just one year in, they have exceeded all three components of their framework. This level of execution builds investor trust.
The market narrative suggests that autonomous vehicle (AV) technology is an existential threat to Uber. Rather than avoiding the issue, Uber’s management has directly addressed it, providing their perspective on the current state of AVs. They acknowledge that while AV technology is advancing, widespread commercialization will take significantly longer. According to management, AVs will only achieve significant market penetration (10%-30% of volumes) when five key conditions are met:
Regulatory Approval – Complex national, state, and city-level regulations must align.
Superhuman Safety Record – AVs must significantly outperform human drivers in safety.
Cost-Effective Hardware – Current hardware costs hundreds of thousands of dollars and must decline to tens of thousands.
Efficient On-the-Ground Operations – AV fleets require strong support for maintenance, charging, and logistics.
High-Utilization Network – Managing demand fluctuations necessitates a hybrid model like Uber's.
I share this sentiment, as I previously outlined in my Uber Quick Pitch, where I expressed my belief that a fleet of autonomous vehicles will not replace human-driven taxis for at least 10 years.
Management believes Uber is well-positioned in the AV space and that it will unlock a meaningful total addressable market, making it a top strategic priority. Uber is investing significant technical, strategic, and managerial resourcesin AV development, including AV fleet supply, which now accounts for 15% of their inventory.
Just this week, Uber announced that Austin residents can now sign up for an interest list directly in their Uber app to increase their chances of matching with a Waymo AV when it launches next month.
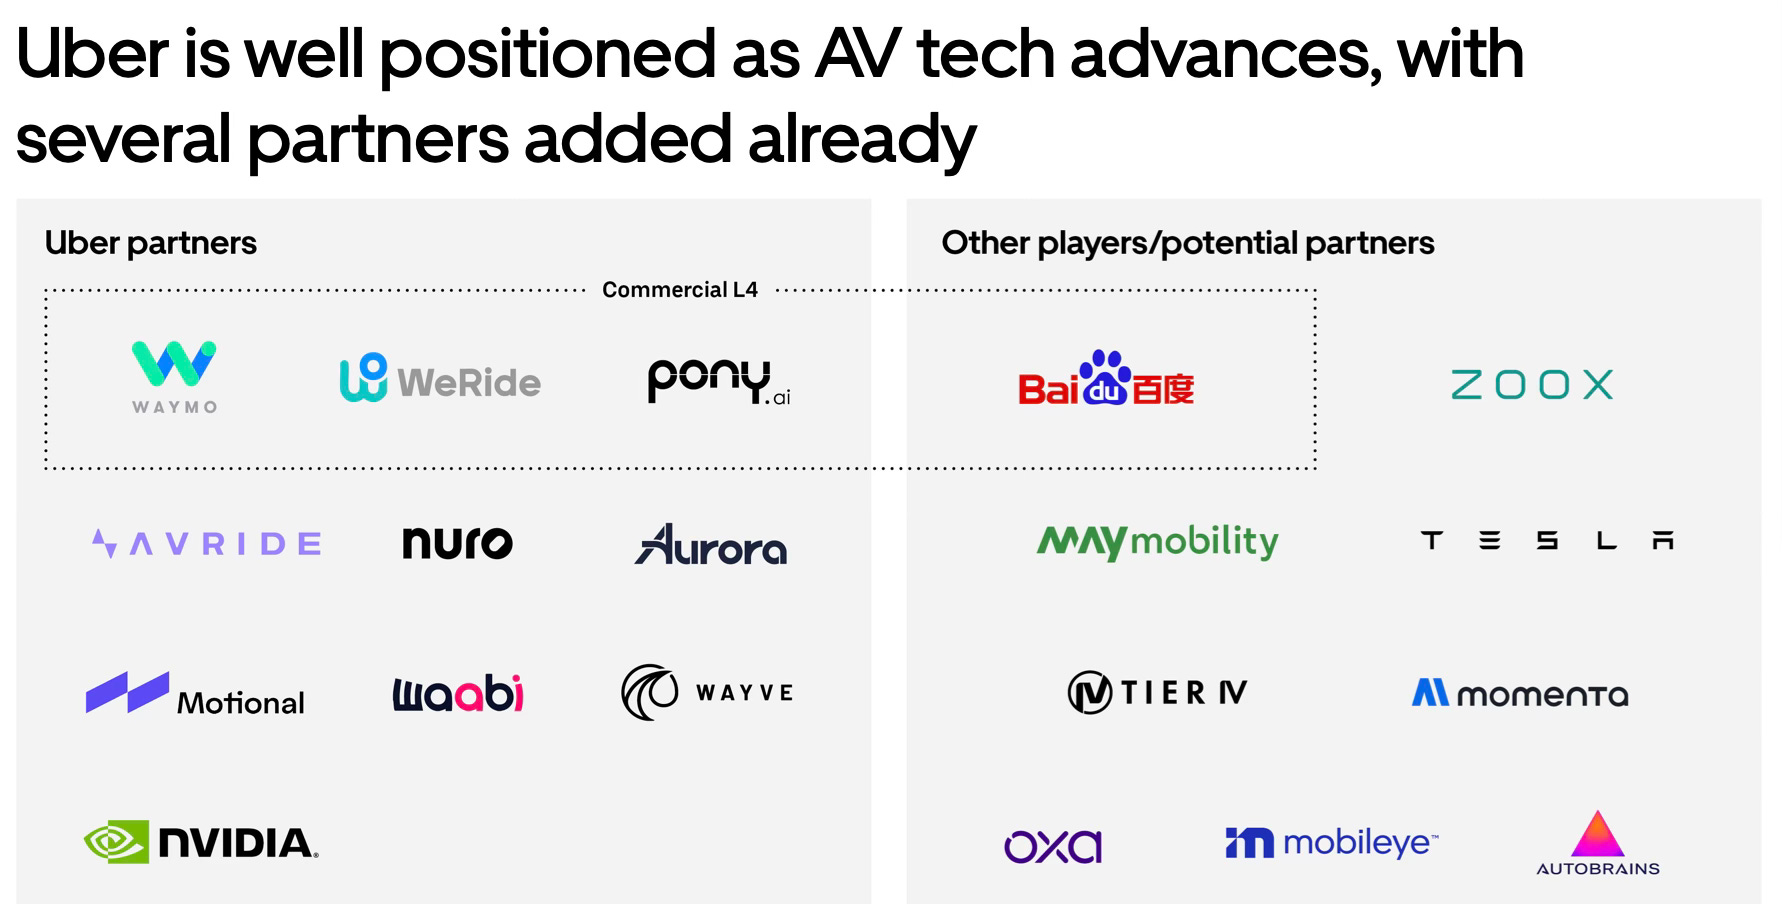
My belief remains that as AV commercialization progresses, more players will enter the market, similar to the rapid innovation seen in generative AI. While today’s AV landscape is largely U.S.-focused, long-term commercialization will likely see multiple players expand both in the U.S. and internationally, much like how DeepSeek emerged in China.
Rating: 4 out of 5. Exceeds expectations.
If you'd like to support the work of an independent analyst, you can buy me a coffee. The proceeds will contribute to covering the annual running costs of the newsletter.
Join the community of informed investors – subscribe now to receive the latest content straight to your inbox each week and never miss out on valuable investment insights.
The Chat is a space designed to facilitate, real-time discussions, share knowledge and debate ideas with fellow investors. Join the conversation.

If you found today's edition helpful, please consider sharing it with your friends and colleagues on social media or via email. Your support helps to continue to provide this newsletter for FREE!
Happy investing
Wolf of Harcourt Street
Contact me
Twitter: @wolfofharcourt
Email: wolfofharcourtstreet@gmail.com