Welcome back to the Wolf of Harcourt Street newsletter.
In this edition, I analyse the 2022 annual report of Airbnb (Ticker: ABNB), which was released on 17 February 2023.
Previous Coverage:
In this report, I will cover the following:
Key Highlights
Business Activity
Income Statement
Balance Sheet
Cash Flow
Guidance
Conclusion
1. Key Highlights
Revenue: $8.4 billion +40% year-over-year (YoY)
Gross Profit: $6.9 billion +43% YoY
Net Income: $1.89 billion compared to a loss of $352 million YoY
2. Business Activity
In 2022, Nights and Experiences Booked of 393.7 million represented an increase of 31% YoY and an increase of 20% compared to 2019 levels. Nights and Experiences Booked grows as Airbnb attract new customers to the platform and as repeat customers increase their activity on the platform. Nights and Experiences Booked increased from prior year levels driven by strong growth across all regions, in particular in Europe, Latin America, and Asia.
Airbnb is a seasonal business, reflecting typical travel behavior patterns over the course of the calendar year. In a typical year, the first, second, and third quarters have higher Nights and Experiences Booked than the fourth quarter, as guests plan for travel during the peak travel season, which is in the third quarter for North America and Europe, the Middle East, and Africa. Therefore, it is important to view the phasing of the full year to get a true picture of the underlying business.
Gross Booking Value (‘GBV’) increased 35% YoY to $63.2 billion in 2022. Management commentary notes that the travel recovery being experienced has been dominated by higher ADR regions—North America and Europe, in particular.
GBV per Night and Experience Booked in 2022 increased compared to 2021, in part because the geographic mix shifted to these higher GBV per Night and Experience Booked regions. Specifically, GBV per Night and Experience Booked in 2022 was $240.29 for North America compared to $127.99 for EMEA, $117.41 for Asia Pacific, and $92.89 for Latin America, with a total global GBV per Night and Experience Booked of $160.56.
3. Income Statement
During the year, Airbnb grew its top line by 40% YoY. Gross profit is following a similar trajectory and increased by 43%, with gross margin also improving from 80.7% to 82.2% YoY.
As alluded to above, the increase in revenue was driven by the stable growth in Nights and Experiences Booked. During 2022, the implied take rate (revenue divided by GBV) was 13.3%, which was up slightly from 12.8% during 2021.
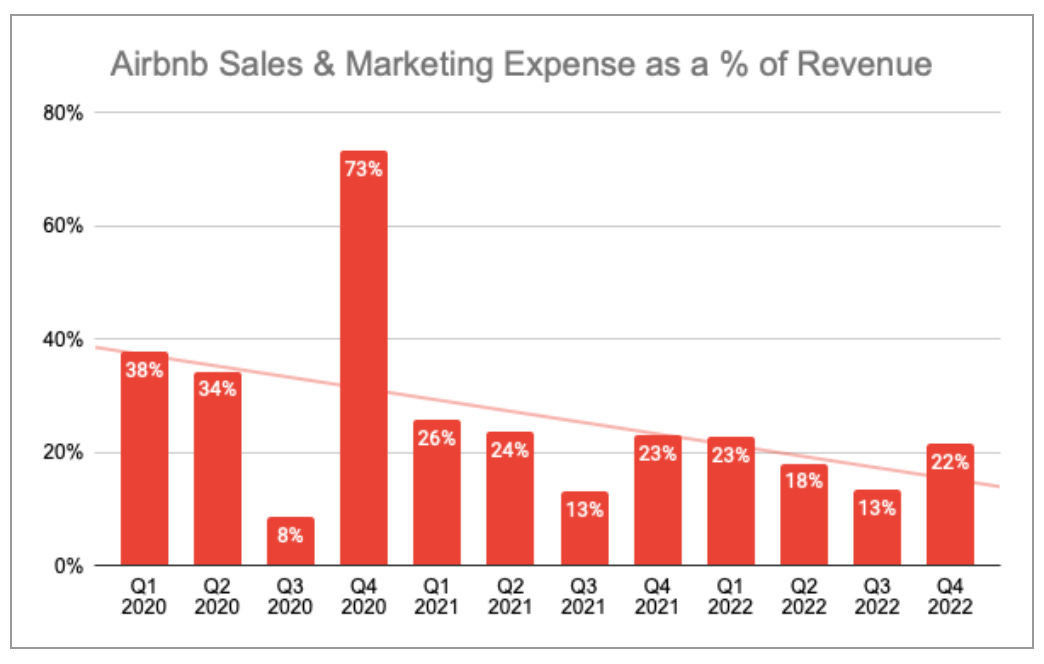
Operating expenses increased by 16% to $5.1 billion during the year. The main driver here was sales and marketing which increased by 28% to $1.52 billion. I mention this a lot in my analysis but the level of spending on sales and marketing expenses is an area I pay particular attention to. Sales and marketing as a percentage of revenue was 18% in 2022. Overall the trend is moving in the right direction as this rate was 20% in 2021 and 35% in 2020.
Overall, Airbnb posted an operating margin of 21% in 2022 compared to 7% in 2021. A 40% increase in revenue resulted in operating income to quadruple. This is a business with an incredibly high operating leverage.
4. Balance Sheet
Observations
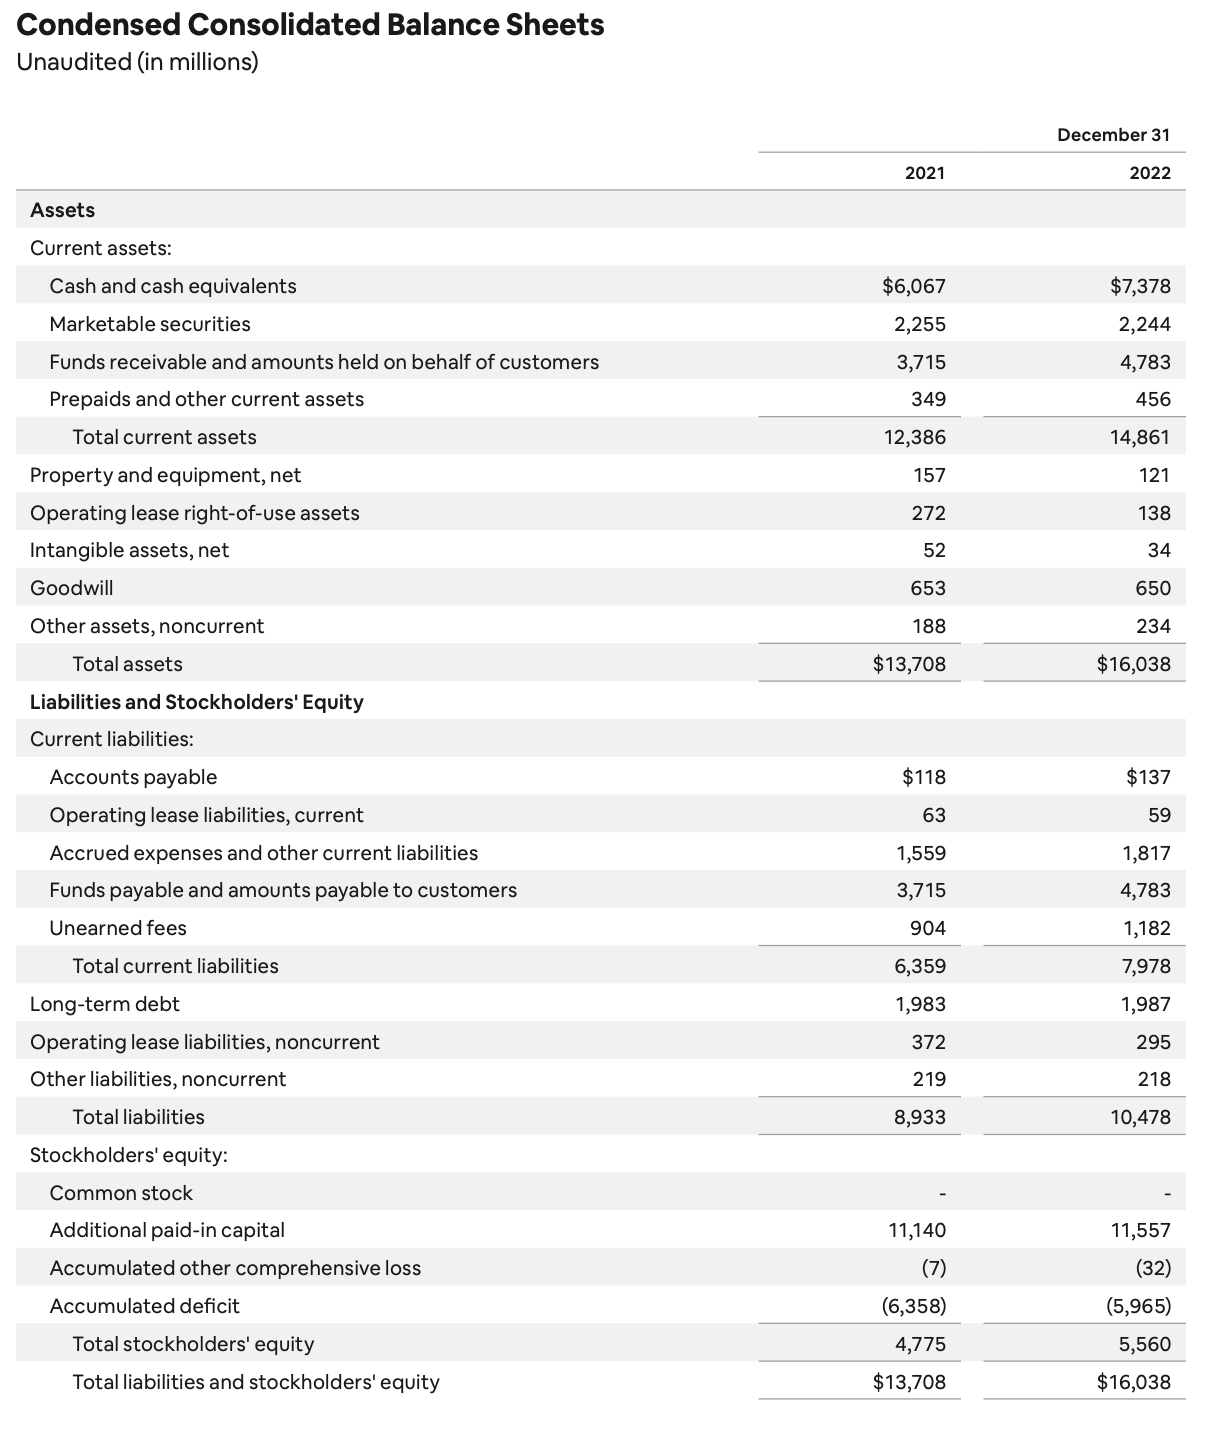
Over $7.3 billion in cash and cash equivalents up from $6 billion at 2021
Total Liabilities as percent of Total Assets is 65% in line with 65% at 2021
Current Assets to Current Liabilities ratio of 1.86 down from 1.95 at 2021
Goodwill balance making up 4% of total assets, no significant movement since 2021
Long-term debt has increased by over $4 million during 2022
5. Cash Flow
Airbnb operating cash flow has increased by 48% during 2022. At year end 2022, cash flow from operations increased from $2.3 billion to $3.4 billion.
One of the main items in the operating cash flow is stock-based compensation (SBC) expense which increased by 3% in 2022. This is a very modest increase.
Airbnb’s investing cash flow resulted in a deficit of $28 million compared to deficit of $1.4 billion in 2021. The key driver here is the reduction in marketable securities purchased.
Airbnb’s financing cash flow resulted in a deficit of $689 million compared to a surplus of $1.3 billion in 2021. The key driver here is the $1.5 billion of share buybacks which is helping to manage dilution from SBC.
Overall, Airbnb produced free cash flow (FCF) of $3.4 billion up 49% from $2.16 billion in 2021. This represents a FCF margin of 41%. How does Airbnb generate so much FCF?
The company benefits from being the Merchant of Record (MoR) which means that it is the party that processes and distributes the actual payment for a product or service. When a customer makes a booking on Airbnb, Airbnb receives the cash in advance. This cash is held on behalf of the host and paid out once the service has been provided. For example, I make a booking on Airbnb for a trip at the end of April. Airbnb receives the cash today. When the services has been provided at the end of April, Airbnb passes the cash to the host net of fees. In this situation, Airbnb has had the cash for “free” for 6 weeks. This gives Airbnb enormous optionality as it continues to scale. It could invest the cash in short term US Treasury bills and earn 5% interest, reinvest the cash in growth initiatives or even pursue M&A activity.
6. Guidance
Management expects revenue for Q1 2023 to be between $1.75 billion and $1.82 billion. The lower end of this revenue range would represent an increase of approximately 16% from Q1 2022, while the higher end of this range would represent an increase of approximately 21%. The implied take rate in Q1 2023 is expected to be similar to Q1 2022. The seasonality of the take rate in 2023 is also expected to be similar to 2022.
Management expect the Adjusted EBITDA margin in Q1 2023 to be slightly down on a YoY basis due to changes in the timing of the brand marketing spend. Compared to Q1 2022, sales and marketing in Q1 2023 is expected to be approximately 150 basis points higher as a percent of revenue, but flat as a percent of revenue for the full year.
Wall Street analysts are currently predicting revenue growth of 15% and earnings growth of 21% in 2023 (Source).
7. Conclusion
2022 was another record year for Airbnb. Since the height of the pandemic in 2020, the company has been able to remain disciplined and maintain a leaner, more focused business model. The fruits of this labour are really being seen now in terms of the operating and free cash flow margins. Nothing sums this up better than the following quote from the CFO Dave Stephenson:
headcount is actually still 5% below where it was in 2019. The other, revenue is 75% higher. So, we're nearly twice as big as we were previously with fewer people
Concurrently, Airbnb has seen a number of positive business trends, including strong demand from guests, who are increasingly booking trips in advance and returning to cities and crossing borders. It’s worth noting that the company has seen tremendous growth in its supply, with 6.6 million active listings at the end of 2022, representing an increase of 16% YoY.
The one blot in the copybook that I would draw the readers attention to is that in Q4 2022, the ADR declined by 1% YoY. Management expect this downward trend to continue in Q1 2023. However, CEO Brian Chesky remarked that the company plans to offset the impact of anticipated ADR declines through fixed cost discipline and variable cost reductions.
Rating: 4 out of 5. Exceeds expectations.
Disclosure: The author holds a long position in Airbnb
Hit subscribe below if you have not already done so in order to receive the latest content straight to your inbox each week.
If you enjoy today’s edition, then feel free to share as it, it really helps.
Happy investing
Wolf of Harcourt Street
Contact me
Twitter: @wolfofharcourt
Email: wolfofharcourtstreet@gmail.com


